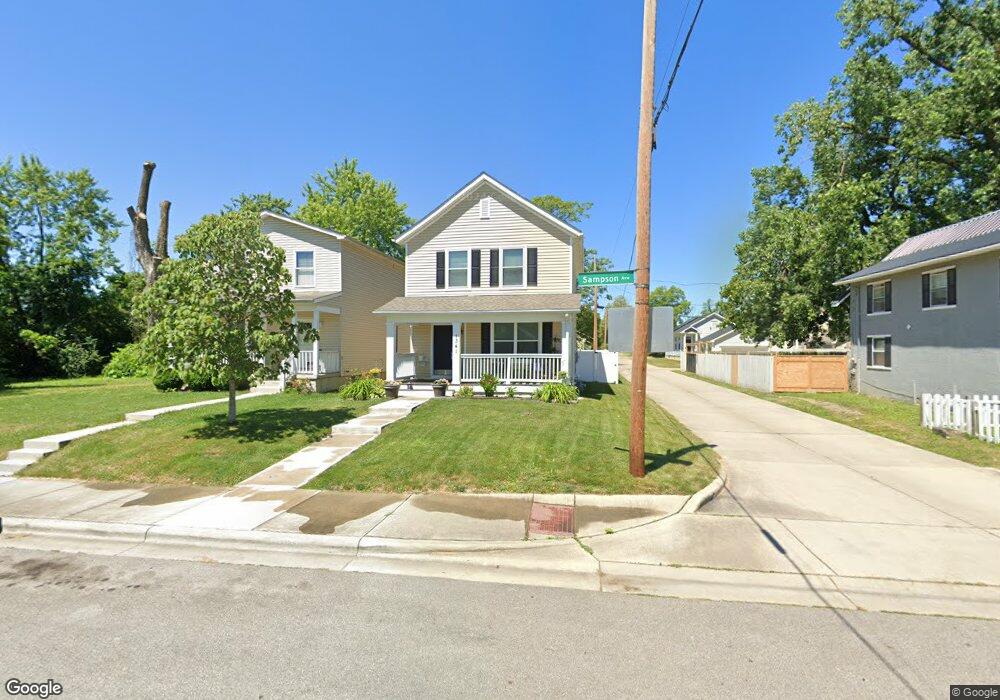
1341 Sampson Ave Columbus, OH 43219
Amercrest NeighborhoodEstimated Value: $215,032 - $259,000
3
Beds
2
Baths
1,436
Sq Ft
$165/Sq Ft
Est. Value
About This Home
This home is located at 1341 Sampson Ave, Columbus, OH 43219 and is currently estimated at $236,258, approximately $164 per square foot. 1341 Sampson Ave is a home with nearby schools including Windsor Stem Acadmey, Linden-Mckinley Stem School On Arcadia, and North Columbus Preparatory Academy.
Ownership History
Date
Name
Owned For
Owner Type
Purchase Details
Closed on
Sep 29, 2017
Sold by
Chp Homeport Homes Llc
Bought by
Caslin Yvette M
Current Estimated Value
Home Financials for this Owner
Home Financials are based on the most recent Mortgage that was taken out on this home.
Original Mortgage
$111,000
Outstanding Balance
$91,998
Interest Rate
3.89%
Mortgage Type
New Conventional
Estimated Equity
$144,260
Purchase Details
Closed on
Aug 8, 2006
Sold by
Ferris Lucita and Jones Ray A
Bought by
Central Ohio Housing Development Organiz
Home Financials for this Owner
Home Financials are based on the most recent Mortgage that was taken out on this home.
Original Mortgage
$128,000
Interest Rate
6.82%
Mortgage Type
Purchase Money Mortgage
Purchase Details
Closed on
Sep 21, 1972
Bought by
Jones Raymond C
Create a Home Valuation Report for This Property
The Home Valuation Report is an in-depth analysis detailing your home's value as well as a comparison with similar homes in the area
Home Values in the Area
Average Home Value in this Area
Purchase History
| Date | Buyer | Sale Price | Title Company |
|---|---|---|---|
| Caslin Yvette M | $116,000 | Land And Mortgage Title Box | |
| Central Ohio Housing Development Organiz | $128,000 | Land & Mo | |
| Jones Raymond C | -- | -- |
Source: Public Records
Mortgage History
| Date | Status | Borrower | Loan Amount |
|---|---|---|---|
| Open | Caslin Yvette M | $111,000 | |
| Previous Owner | Central Ohio Housing Development Organiz | $128,000 |
Source: Public Records
Tax History
| Year | Tax Paid | Tax Assessment Tax Assessment Total Assessment is a certain percentage of the fair market value that is determined by local assessors to be the total taxable value of land and additions on the property. | Land | Improvement |
|---|---|---|---|---|
| 2025 | $209 | $68,680 | $4,660 | $64,020 |
| 2024 | $209 | $68,680 | $4,660 | $64,020 |
| 2023 | $206 | $68,670 | $4,655 | $64,015 |
| 2022 | $116 | $47,530 | $2,240 | $45,290 |
| 2021 | $116 | $47,530 | $2,240 | $45,290 |
| 2020 | $117 | $47,530 | $2,240 | $45,290 |
| 2019 | $113 | $39,630 | $1,860 | $37,770 |
| 2018 | $1,216 | $39,630 | $1,860 | $37,770 |
| 2017 | $116 | $1,860 | $1,860 | $0 |
| 2016 | $36 | $530 | $530 | $0 |
| 2015 | $33 | $530 | $530 | $0 |
| 2014 | $33 | $530 | $530 | $0 |
| 2013 | $18 | $595 | $595 | $0 |
Source: Public Records
Map
Nearby Homes
- 1312 Lee Ave
- 0 Dewey Ave Unit 225022874
- 1638 Joyce Ave
- 1951 Joyce Ave
- 0 Bretton Rd Unit 225029828
- 1549 Delbert Rd
- 0 Windsor Ave
- 821 Taylor Ave Unit 23
- 00 Taylor Ave
- 1437 E 19th Ave
- 1331 Woodnell Ave
- 1249-1251 E 15th Ave
- 1198 Woodnell Ave
- 1245 Brentnell Ave
- 0 Taylor Ave Unit 225029840
- 1477 Dove Dr
- 1315 E 18th Ave
- 0 Leona Ave
- 1740 Old Leonard Ave
- 1121 Windsor Ave
- 1337 Sampson Ave
- 1347 Sampson Ave
- 1330 Sampson Ave
- 1320 Sampson Ave
- 1338 Lee Ave
- 0 Sampson Ave
- 1334 Lee Ave
- 0 Lee Ave
- 1312 Sampson Ave Unit Lot 157
- 1348 Lee Ave
- 1627 E 12th Ave
- 1352 Lee Ave
- 1301 Sampson Ave
- 1304 Sampson Ave
- 1615 E 12th Ave
- 1295 Sampson Ave
- 1322 Lee Ave
- 1321 Key Ave W
- 1315 Key West Ave
- 1294 Sampson Ave
Your Personal Tour Guide
Ask me questions while you tour the home.