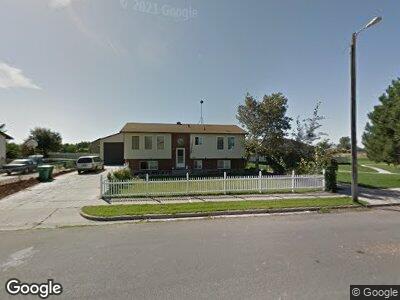
1341 W 1045 S Clearfield, UT 84015
Estimated Value: $405,000 - $436,000
4
Beds
2
Baths
1,990
Sq Ft
$214/Sq Ft
Est. Value
About This Home
This home is located at 1341 W 1045 S, Clearfield, UT 84015 and is currently estimated at $426,139, approximately $214 per square foot. 1341 W 1045 S is a home located in Davis County with nearby schools including Cook School, Syracuse Junior High School, and Syracuse High School.
Ownership History
Date
Name
Owned For
Owner Type
Purchase Details
Closed on
May 13, 2014
Sold by
Greenman Arthur B and Greenman Milagros E
Bought by
Greenman Arthur B and Greenman Milagros D
Current Estimated Value
Purchase Details
Closed on
Feb 1, 2001
Sold by
Greenman Arthur B
Bought by
Greenman Arthur B and Greenman Milagros E
Purchase Details
Closed on
Apr 29, 1999
Sold by
Pratt Merlin G and Pratt Maria L
Bought by
Greenman Arthur B
Home Financials for this Owner
Home Financials are based on the most recent Mortgage that was taken out on this home.
Original Mortgage
$78,000
Interest Rate
6.98%
Purchase Details
Closed on
Jun 13, 1997
Sold by
Pratt Merlin G
Bought by
Pratt Merlin G and Pratt Maria
Home Financials for this Owner
Home Financials are based on the most recent Mortgage that was taken out on this home.
Original Mortgage
$92,000
Interest Rate
7.94%
Purchase Details
Closed on
Dec 27, 1994
Sold by
Rivera Ralph L and Rivera Shirley
Bought by
Pratt Merlin G and Pratt Maria L
Create a Home Valuation Report for This Property
The Home Valuation Report is an in-depth analysis detailing your home's value as well as a comparison with similar homes in the area
Home Values in the Area
Average Home Value in this Area
Purchase History
| Date | Buyer | Sale Price | Title Company |
|---|---|---|---|
| Greenman Arthur B | -- | None Available | |
| Greenman Arthur B | -- | Us Title | |
| Greenman Arthur B | -- | Avis & Archibald Title | |
| Pratt Merlin G | -- | U S Title | |
| Pratt Merlin G | -- | U S Title | |
| Pratt Merlin G | -- | U S Title |
Source: Public Records
Mortgage History
| Date | Status | Borrower | Loan Amount |
|---|---|---|---|
| Closed | Greenman Arthur B | $78,000 | |
| Previous Owner | Pratt Merlin G | $92,000 |
Source: Public Records
Tax History Compared to Growth
Tax History
| Year | Tax Paid | Tax Assessment Tax Assessment Total Assessment is a certain percentage of the fair market value that is determined by local assessors to be the total taxable value of land and additions on the property. | Land | Improvement |
|---|---|---|---|---|
| 2024 | $2,303 | $207,899 | $71,861 | $136,038 |
| 2023 | $2,131 | $194,150 | $63,089 | $131,060 |
| 2022 | $2,228 | $363,000 | $118,941 | $244,059 |
| 2021 | $2,009 | $272,000 | $71,012 | $200,988 |
| 2020 | $1,755 | $236,000 | $59,995 | $176,005 |
| 2019 | $1,725 | $229,000 | $61,869 | $167,131 |
| 2018 | $1,578 | $204,000 | $54,915 | $149,085 |
| 2016 | $1,359 | $91,850 | $22,033 | $69,817 |
| 2015 | $1,315 | $84,755 | $22,033 | $62,722 |
| 2014 | $1,236 | $80,728 | $22,033 | $58,695 |
| 2013 | -- | $69,523 | $32,670 | $36,853 |
Source: Public Records
Map
Nearby Homes
- 1341 W 1045 S
- 1323 W 1045 S
- 1342 W 1100 S
- 1328 W 1100 S
- 1309 W 1045 S
- 1356 W 1100 S
- 1038 S 1350 W
- 1320 W 1045 S
- 1216 W 1100 S Unit 104
- 1216 W 1100 S Unit 106
- 1104 S 1325 W
- 1104 S 1325 W Unit 24
- 1299 W 1045 S
- 1039 S 1350 W
- 1282 W 1100 S Unit 105
- 1380 W 1045 S
- 1124 S 1325 W
- 1111 S 1325 W
- 1310 W 1045 S
- 1030 S 1350 W