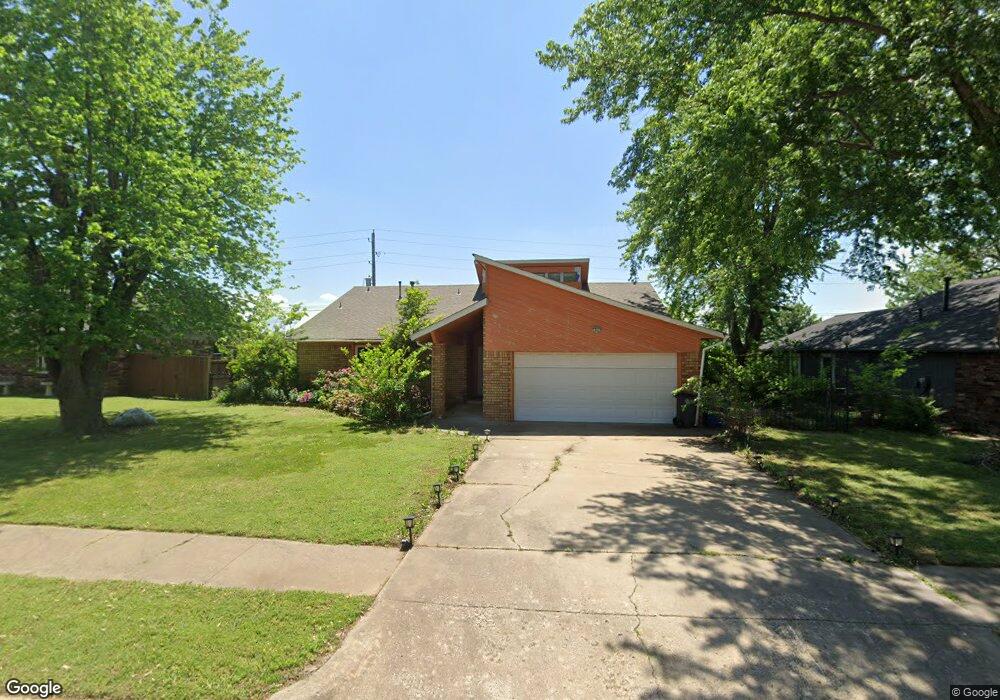
13412 E 46th St Tulsa, OK 74134
Park Plaza East NeighborhoodEstimated Value: $234,136 - $247,000
3
Beds
2
Baths
1,667
Sq Ft
$145/Sq Ft
Est. Value
About This Home
This home is located at 13412 E 46th St, Tulsa, OK 74134 and is currently estimated at $241,534, approximately $144 per square foot. 13412 E 46th St is a home located in Tulsa County with nearby schools including Rosa Parks Elementary School, Union 8th Grade Center, and Union 6th-7th Grade Center.
Ownership History
Date
Name
Owned For
Owner Type
Purchase Details
Closed on
Mar 29, 2012
Sold by
Hamilton Jerome and Hamilton Annie
Bought by
Carbajal Bertha
Current Estimated Value
Home Financials for this Owner
Home Financials are based on the most recent Mortgage that was taken out on this home.
Original Mortgage
$120,856
Outstanding Balance
$82,577
Interest Rate
3.91%
Mortgage Type
FHA
Estimated Equity
$158,957
Purchase Details
Closed on
Dec 1, 2005
Sold by
Inglett James K and Inglett Nancy S
Bought by
Issa Joseph and Issa Patricia
Purchase Details
Closed on
Aug 1, 1985
Create a Home Valuation Report for This Property
The Home Valuation Report is an in-depth analysis detailing your home's value as well as a comparison with similar homes in the area
Home Values in the Area
Average Home Value in this Area
Purchase History
| Date | Buyer | Sale Price | Title Company |
|---|---|---|---|
| Carbajal Bertha | $124,000 | None Available | |
| Issa Joseph | $120,000 | First American Title & Abstr | |
| -- | $73,000 | -- |
Source: Public Records
Mortgage History
| Date | Status | Borrower | Loan Amount |
|---|---|---|---|
| Open | Carbajal Bertha | $120,856 |
Source: Public Records
Tax History
| Year | Tax Paid | Tax Assessment Tax Assessment Total Assessment is a certain percentage of the fair market value that is determined by local assessors to be the total taxable value of land and additions on the property. | Land | Improvement |
|---|---|---|---|---|
| 2025 | $2,477 | $18,116 | $2,119 | $15,997 |
| 2024 | $2,101 | $17,253 | $2,276 | $14,977 |
| 2023 | $2,101 | $16,431 | $2,194 | $14,237 |
| 2022 | $2,085 | $15,648 | $3,039 | $12,609 |
| 2021 | $2,011 | $14,904 | $2,895 | $12,009 |
| 2020 | $1,888 | $14,194 | $2,953 | $11,241 |
| 2019 | $1,954 | $14,194 | $2,953 | $11,241 |
| 2018 | $1,873 | $13,640 | $2,838 | $10,802 |
| 2017 | $1,884 | $13,640 | $2,838 | $10,802 |
| 2016 | $1,843 | $13,640 | $2,838 | $10,802 |
| 2015 | $1,863 | $13,640 | $2,838 | $10,802 |
| 2014 | $1,833 | $13,640 | $2,838 | $10,802 |
Source: Public Records
Map
Nearby Homes
- 4517 S 135th East Ave
- 13302 E 43rd St
- 4014 S 132nd East Ave
- 4301 N Walnut Ave
- 4010 S 133rd East Ave
- 2435 W Omaha St
- 4916 N Walnut Ave
- 4904 N Walnut Ave
- 4924 N Walnut Ave
- 4932 N Walnut Ave
- 4912 N Walnut Ave
- 5003 N Walnut Place
- 4915 N Walnut Place
- 4915 N Walnut Ave
- 5003 N Walnut Ave
- 4928 N Walnut Ave
- 5010 N Walnut Ave
- 2000 W Vail St
- 1907 W Rockport Place
- 3914 S 125th East Ave
- 13418 E 46th St
- 13406 E 46th St
- 13422 E 46th St
- 13402 E 46th St
- 13411 E 46th St
- 13417 E 46th St
- 4525 S 134th East Ave
- 13428 E 46th St
- 13270 E 46th St
- 13423 E 46th St
- 13429 E 46th St
- 4517 S 134th East Ave
- 13420 E 45th St
- 13416 E 45th St
- 13434 E 46th St
- 4524 S 134th Ave E
- 4532 S 135th East Ave
- 4516 S 134th East Ave
- 4509 S 134th East Ave
- 13260 E 46th St
Your Personal Tour Guide
Ask me questions while you tour the home.