Estimated Value: $821,000 - $1,064,000
2
Beds
2
Baths
1,340
Sq Ft
$693/Sq Ft
Est. Value
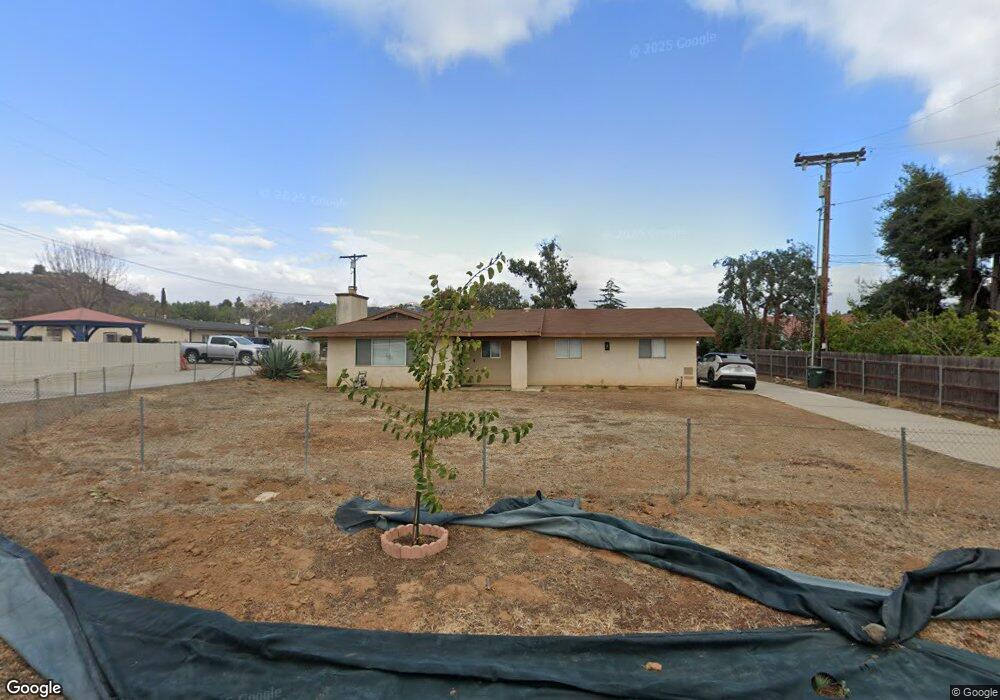
About This Home
This home is located at 13415 Olive Tree Ln, Poway, CA 92064 and is currently estimated at $928,224, approximately $692 per square foot. 13415 Olive Tree Ln is a home located in San Diego County with nearby schools including Garden Road Elementary, Twin Peaks Middle, and Poway High.
Ownership History
Date
Name
Owned For
Owner Type
Purchase Details
Closed on
Aug 22, 2011
Sold by
Allbaugh John B
Bought by
Allbaugh John B
Current Estimated Value
Purchase Details
Closed on
Sep 15, 2010
Sold by
Allbaugh John and Allbaugh Teresa M
Bought by
Bell Beverly B
Purchase Details
Closed on
Aug 25, 2010
Sold by
Evans Ann
Bought by
Allbaugh John and Allbaugh Teresa M
Purchase Details
Closed on
Apr 7, 2008
Sold by
Bolles Robert C
Bought by
Bolles Robert C and Robert Bolles Family Trust
Purchase Details
Closed on
Mar 4, 2008
Sold by
Evans Ann B and Bolles Robert C
Bought by
Evans Ann B and Bolles Robert C
Purchase Details
Closed on
Jun 18, 2007
Sold by
Bolles Lawrence W and Evans Ann B
Bought by
Bolles Lawrence W and Evans Ann B
Purchase Details
Closed on
Feb 2, 1998
Sold by
Evans Ann Family Trust 02-13-91 and Evans Ann
Bought by
Bolles Lawrence W and Bolles Elizabeth H
Create a Home Valuation Report for This Property
The Home Valuation Report is an in-depth analysis detailing your home's value as well as a comparison with similar homes in the area
Home Values in the Area
Average Home Value in this Area
Purchase History
| Date | Buyer | Sale Price | Title Company |
|---|---|---|---|
| Allbaugh John B | -- | Orange Coast Title Company | |
| Allbaugh John B | -- | Orange Coast Title Company | |
| Bell Beverly B | -- | North American Title Company | |
| Allbaugh John | $450,000 | North American Title Company | |
| Bolles Robert C | -- | None Available | |
| Evans Ann | -- | None Available | |
| Evans Ann B | -- | None Available | |
| Bolles Lawrence W | -- | None Available | |
| Bolles Lawrence W | $87,500 | -- |
Source: Public Records
Tax History
| Year | Tax Paid | Tax Assessment Tax Assessment Total Assessment is a certain percentage of the fair market value that is determined by local assessors to be the total taxable value of land and additions on the property. | Land | Improvement |
|---|---|---|---|---|
| 2025 | $6,435 | $576,517 | $390,751 | $185,766 |
| 2024 | $6,435 | $565,214 | $383,090 | $182,124 |
| 2023 | $6,300 | $554,132 | $375,579 | $178,553 |
| 2022 | $6,196 | $543,267 | $368,215 | $175,052 |
| 2021 | $6,116 | $532,616 | $360,996 | $171,620 |
| 2020 | $6,035 | $527,156 | $357,295 | $169,861 |
| 2019 | $5,879 | $516,821 | $350,290 | $166,531 |
| 2018 | $5,716 | $506,688 | $343,422 | $163,266 |
| 2017 | $5,565 | $496,754 | $336,689 | $160,065 |
| 2016 | $5,451 | $487,015 | $330,088 | $156,927 |
| 2015 | $5,372 | $479,700 | $325,130 | $154,570 |
| 2014 | $5,024 | $450,000 | $353,000 | $97,000 |
Source: Public Records
Map
Nearby Homes
- 13462 Montego Dr
- 13428 Standish Dr
- 13643 Melissa Ln
- 13419 Sebago Ave
- 13209 Neddick Ave
- 14298 Ipava Dr
- 14550 Dehia St
- 14523 Saco St
- 14525 Kittery St
- 000 Carlson Ct 9 Unit 9
- 14003 Jasmine Ave Unit 193
- 13908 Hibiscus Ave Unit 40
- 13941 Wisteria Ave
- 13001 Standish Dr
- 14610 Fairburn St
- 13435 Frey Ct
- 12671 Claire Dr
- 13947 Midland Rd
- 13422 Little Dawn Ln
- 13746 Paseo Bonita
- 13423 Olive Tree Ln
- 13418 Olive Tree Ln Unit 79
- 13418 Olive Tree Ln
- 13412 Olive Tree Ln
- 13347 Olive Tree Ln
- 13424 Olive Tree Ln
- 13421 Olive Tree Ln
- 13406 Olive Tree Ln
- 13348 Olive Tree Ln
- 13427 Olive Tree Ln
- 13391 Via Stephen
- 13397 Via Stephen
- 13342 Olive Tree Ln
- 14336 Poway Rd
- 13385 Via Stephen
- 13430 Olive Tree Ln
- 13379 Via Stephen
- 14044 Via Lisa
- 14340 Poway Rd
- 13429 Olive Tree Ln Unit 45
Your Personal Tour Guide
Ask me questions while you tour the home.