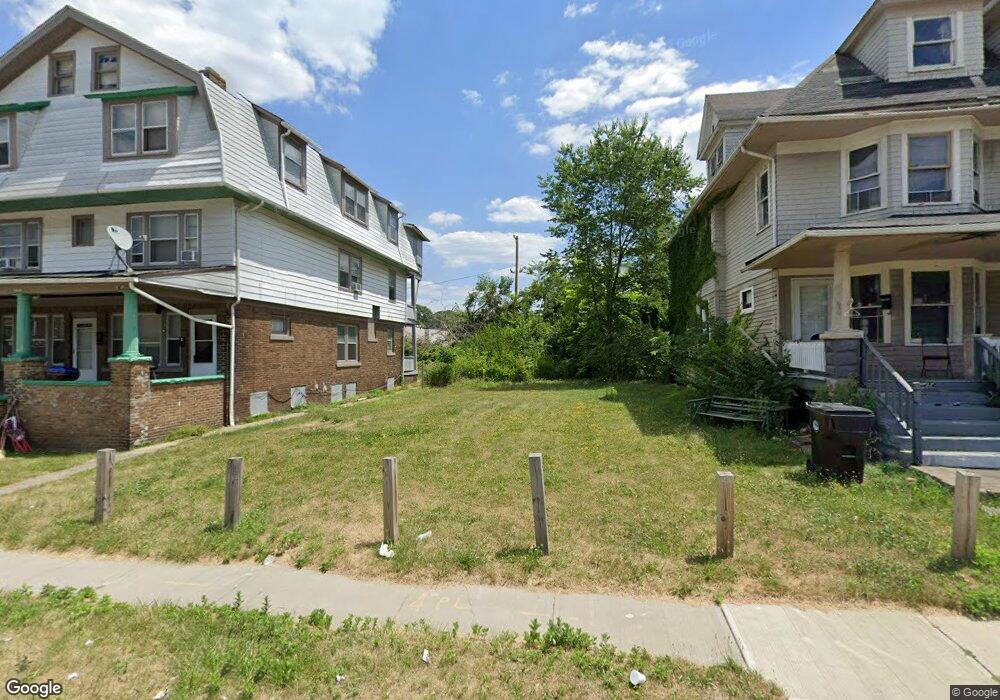
13416 Emily St Cleveland, OH 44112
Estimated Value: $51,000
6
Beds
2
Baths
3,544
Sq Ft
$14/Sq Ft
Est. Value
About This Home
This home is located at 13416 Emily St, Cleveland, OH 44112 and is currently priced at $51,000, approximately $14 per square foot. 13416 Emily St is a home located in Cuyahoga County with nearby schools including Shaw High School and Citizens Academy.
Ownership History
Date
Name
Owned For
Owner Type
Purchase Details
Closed on
Jun 18, 2013
Sold by
Strategic Advantage Llc and Heaps Nate
Bought by
Lpx Home Enterprises Inc
Current Estimated Value
Purchase Details
Closed on
May 6, 2013
Sold by
Go Invest Wisely Llc
Bought by
Strategic Advantage Llc
Purchase Details
Closed on
Jan 23, 2009
Sold by
Bryce Peters Financial
Bought by
Go Invest Wisely Llc
Purchase Details
Closed on
Oct 3, 2008
Sold by
Citicorp Trust Bank Fsb
Bought by
Bryce Peters Financial Corp
Purchase Details
Closed on
Jan 4, 2007
Sold by
Farrow Allen M and Farrow Darlene I
Bought by
Citicorp Trust Bank Fsb and Travelers Bank & Trust Fsb
Purchase Details
Closed on
Sep 28, 1993
Sold by
Farrow Allen M
Bought by
Farrow Allen M
Purchase Details
Closed on
Sep 3, 1993
Sold by
Farrow Roberta
Bought by
Farrow Allen M
Purchase Details
Closed on
May 30, 1985
Sold by
Neal Vaughn O and Neal Velma
Bought by
Farrow Roberta
Purchase Details
Closed on
Jan 1, 1975
Bought by
Neal Vaughn O and Neal Velma
Create a Home Valuation Report for This Property
The Home Valuation Report is an in-depth analysis detailing your home's value as well as a comparison with similar homes in the area
Home Values in the Area
Average Home Value in this Area
Purchase History
| Date | Buyer | Sale Price | Title Company |
|---|---|---|---|
| Lpx Home Enterprises Inc | $13,830 | None Available | |
| Strategic Advantage Llc | $12,230 | None Available | |
| Go Invest Wisely Llc | $1,000 | Metro | |
| Bryce Peters Financial Corp | $61,800 | First American Els | |
| Citicorp Trust Bank Fsb | $64,900 | None Available | |
| Farrow Allen M | -- | -- | |
| Farrow Allen M | -- | -- | |
| Farrow Roberta | $16,000 | -- | |
| Neal Vaughn O | -- | -- |
Source: Public Records
Tax History Compared to Growth
Tax History
| Year | Tax Paid | Tax Assessment Tax Assessment Total Assessment is a certain percentage of the fair market value that is determined by local assessors to be the total taxable value of land and additions on the property. | Land | Improvement |
|---|---|---|---|---|
| 2024 | -- | $700 | $700 | -- |
| 2022 | $0 | $530 | $530 | $0 |
| 2021 | $0 | $530 | $530 | $0 |
| 2020 | $0 | $530 | $530 | $0 |
| 2019 | $44 | $0 | $0 | $0 |
| 2018 | $602 | $530 | $530 | $0 |
| 2017 | $144 | $0 | $0 | $0 |
| 2016 | $144 | $10,610 | $2,870 | $7,740 |
| 2015 | $18,013 | $10,610 | $2,870 | $7,740 |
| 2014 | $18,013 | $12,460 | $3,360 | $9,100 |
Source: Public Records
Map
Nearby Homes
- 1198 Rozelle Ave
- 1827 Idlewood Ave
- 1679 Lockwood Ave
- 1229 Melbourne Rd
- 1184 Melbourne Rd
- 1521 Lakefront Ave
- 1217 E 125th St
- 1720 Debra Ann Ln
- 1200 E 125th St
- 1007 E 131st St
- 1333 E 124th St
- 1818 Knowles St
- 986 E 130th St
- 990 E 129th St
- 1069 Carlyon Rd
- 974 E 129th St
- 1003 Eddy Rd
- 1855 Woodlawn Ave
- 12337 Chesterfield Ave
- 1858 Woodlawn Ave
- 13412 Emily St
- 13420 Emily St
- 13410 Emily St
- 13500 Emily St
- 13406 Emily St
- 13404 Emily St
- 13402 Emily St
- 13400 Emily St
- 13508 Emily St
- 13328 Emily St
- 13513 Emily St
- 13517 Emily St
- 13521 Emily St
- 13608 Emily St
- 13592 Euclid Ave Unit Suite B
- 13592 Euclid Ave
- 13613 Emily St
- 1766 Wheeler Ave
- 13441 Euclid Ave
- 1764 Wheeler Ave