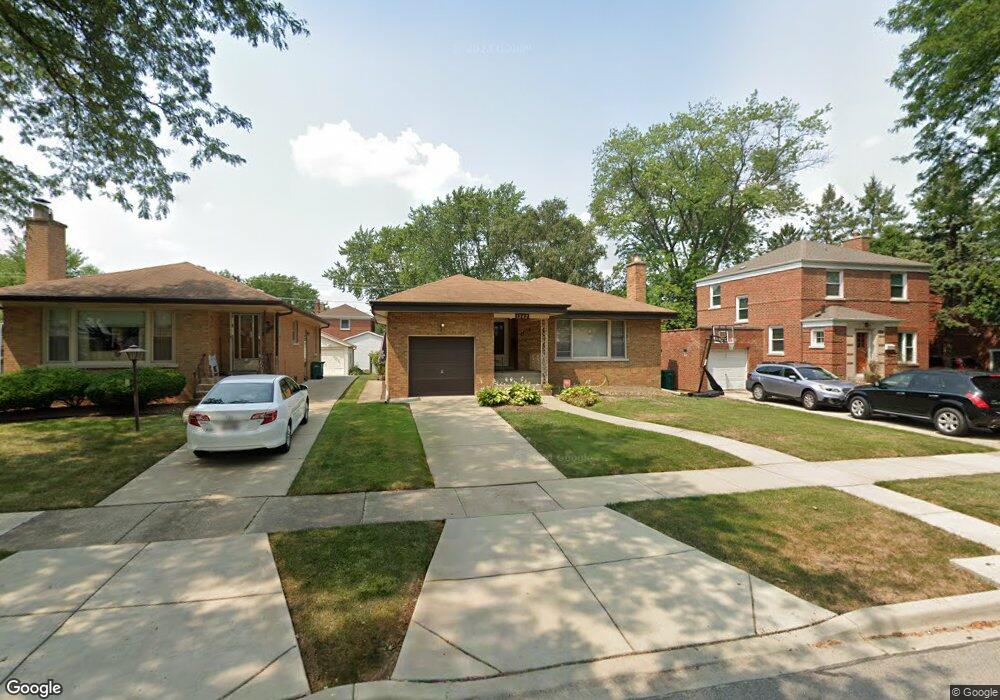
1342 Portsmouth Ave Westchester, IL 60154
Estimated Value: $317,661 - $354,000
2
Beds
2
Baths
1,151
Sq Ft
$288/Sq Ft
Est. Value
About This Home
This home is located at 1342 Portsmouth Ave, Westchester, IL 60154 and is currently estimated at $331,415, approximately $287 per square foot. 1342 Portsmouth Ave is a home located in Cook County with nearby schools including Westchester Primary School, Westchester Intermediate School, and Westchester Middle School.
Ownership History
Date
Name
Owned For
Owner Type
Purchase Details
Closed on
Jul 9, 2019
Sold by
Schmidt James H and Schmidt Mara R
Bought by
Schmidt James H and Schmidt Mara R
Current Estimated Value
Purchase Details
Closed on
May 30, 2017
Sold by
Lyons Robert and Lyons Suzanne
Bought by
Schmidt James H and Schmidt Mara R
Purchase Details
Closed on
Sep 28, 2016
Sold by
Lyons Joan and Lyons Robert
Bought by
Lyons Robert and Lyons Suzanne
Purchase Details
Closed on
Oct 30, 2001
Sold by
Erman Anthony J and Erman Marilyn K
Bought by
Lyons Terrence R and Lyons Joan
Home Financials for this Owner
Home Financials are based on the most recent Mortgage that was taken out on this home.
Original Mortgage
$177,750
Interest Rate
6.87%
Create a Home Valuation Report for This Property
The Home Valuation Report is an in-depth analysis detailing your home's value as well as a comparison with similar homes in the area
Home Values in the Area
Average Home Value in this Area
Purchase History
| Date | Buyer | Sale Price | Title Company |
|---|---|---|---|
| Schmidt James H | -- | Attorney | |
| Schmidt James H | $235,000 | None Available | |
| Lyons Robert | -- | None Available | |
| Lyons Terrence R | $197,500 | -- |
Source: Public Records
Mortgage History
| Date | Status | Borrower | Loan Amount |
|---|---|---|---|
| Previous Owner | Lyons Terrence R | $177,750 |
Source: Public Records
Tax History Compared to Growth
Tax History
| Year | Tax Paid | Tax Assessment Tax Assessment Total Assessment is a certain percentage of the fair market value that is determined by local assessors to be the total taxable value of land and additions on the property. | Land | Improvement |
|---|---|---|---|---|
| 2024 | $3,068 | $17,062 | $3,283 | $13,779 |
| 2023 | $2,898 | $17,062 | $3,283 | $13,779 |
| 2022 | $2,898 | $15,041 | $2,814 | $12,227 |
| 2021 | $3,556 | $15,040 | $2,814 | $12,226 |
| 2020 | $3,534 | $15,040 | $2,814 | $12,226 |
| 2019 | $3,533 | $15,591 | $2,579 | $13,012 |
| 2018 | $3,485 | $15,591 | $2,579 | $13,012 |
| 2017 | $3,433 | $15,591 | $2,579 | $13,012 |
| 2016 | $4,360 | $14,950 | $2,345 | $12,605 |
| 2015 | $3,139 | $14,950 | $2,345 | $12,605 |
| 2014 | $3,090 | $14,950 | $2,345 | $12,605 |
| 2013 | $3,307 | $17,212 | $2,345 | $14,867 |
Source: Public Records
Map
Nearby Homes
- 10072 Drury Ln
- 1119 Newcastle Ave
- 1500 Bristol Ave
- 1623 Manchester Ave
- 1247 S Mannheim Rd Unit 3
- 1601 Bristol Ave
- 920 Suffolk Ave
- 923 Manchester Ave
- 1816 Manchester Ave
- 814 Norfolk Ave
- 805 Norfolk Ave
- 1907 Suffolk Ave
- 1900 Manchester Ave
- 1840 Gardner Rd
- 10524 Camelot St
- 750 Bristol Ave
- 10531 Camelot St
- 1932 Newcastle Ave
- 723 Balmoral Ave
- 626 Manchester Ave
- 1342 Portsmouth Ave
- 1336 Portsmouth Ave
- 1346 Portsmouth Ave
- 1332 Portsmouth Ave
- 1352 Portsmouth Ave
- 1343 Newcastle Ave
- 1328 Portsmouth Ave
- 1337 Newcastle Ave
- 1347 Newcastle Ave
- 1358 Portsmouth Ave
- 1333 Newcastle Ave
- 1353 Newcastle Ave
- 1327 Newcastle Ave
- 1341 Portsmouth Ave
- 1322 Portsmouth Ave
- 1347 Portsmouth Ave
- 1335 Portsmouth Ave
- 1359 Newcastle Ave
- 1353 Portsmouth Ave
- 1331 Portsmouth Ave