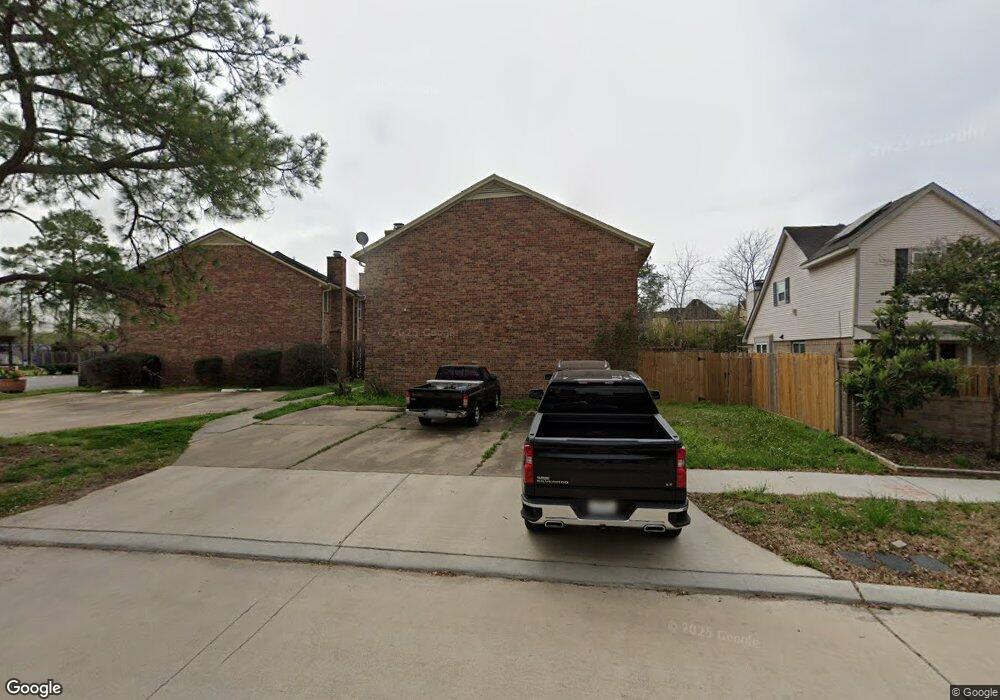
13423 Gaby Virbo Dr Unit 4 Houston, TX 77083
Alief NeighborhoodEstimated Value: $152,000 - $201,000
2
Beds
3
Baths
1,300
Sq Ft
$136/Sq Ft
Est. Value
About This Home
This home is located at 13423 Gaby Virbo Dr Unit 4, Houston, TX 77083 and is currently estimated at $177,228, approximately $136 per square foot. 13423 Gaby Virbo Dr Unit 4 is a home located in Harris County with nearby schools including Liestman Elementary School, Youngblood Intermediate School, and Elsik High School.
Ownership History
Date
Name
Owned For
Owner Type
Purchase Details
Closed on
Dec 31, 2015
Sold by
Vu Tuyet
Bought by
Vallejo Juan Francisco and Vallejo Esther
Current Estimated Value
Home Financials for this Owner
Home Financials are based on the most recent Mortgage that was taken out on this home.
Original Mortgage
$63,300
Outstanding Balance
$50,377
Interest Rate
3.98%
Mortgage Type
New Conventional
Estimated Equity
$126,851
Purchase Details
Closed on
May 29, 2015
Sold by
Malhotra Satish C and Malhotra Surita
Bought by
Vu Tuyet
Purchase Details
Closed on
Oct 28, 1994
Sold by
Rao Gavvala R and Gavvala Usha
Bought by
Malhotra Surita and Malhotra Satish C
Home Financials for this Owner
Home Financials are based on the most recent Mortgage that was taken out on this home.
Original Mortgage
$17,715
Interest Rate
8.88%
Create a Home Valuation Report for This Property
The Home Valuation Report is an in-depth analysis detailing your home's value as well as a comparison with similar homes in the area
Home Values in the Area
Average Home Value in this Area
Purchase History
| Date | Buyer | Sale Price | Title Company |
|---|---|---|---|
| Vallejo Juan Francisco | -- | None Available | |
| Vu Tuyet | -- | South Land Title Llc | |
| Malhotra Surita | -- | Chicago Title |
Source: Public Records
Mortgage History
| Date | Status | Borrower | Loan Amount |
|---|---|---|---|
| Open | Vallejo Juan Francisco | $63,300 | |
| Previous Owner | Malhotra Surita | $17,715 |
Source: Public Records
Tax History Compared to Growth
Tax History
| Year | Tax Paid | Tax Assessment Tax Assessment Total Assessment is a certain percentage of the fair market value that is determined by local assessors to be the total taxable value of land and additions on the property. | Land | Improvement |
|---|---|---|---|---|
| 2025 | $3,099 | $140,775 | $3,796 | $136,979 |
| 2024 | $3,099 | $141,347 | $3,796 | $137,551 |
| 2023 | $3,099 | $141,347 | $3,796 | $137,551 |
| 2022 | $2,974 | $125,859 | $3,073 | $122,786 |
| 2021 | $2,233 | $93,156 | $2,531 | $90,625 |
| 2020 | $2,375 | $94,206 | $2,169 | $92,037 |
| 2019 | $2,494 | $91,588 | $1,428 | $90,160 |
| 2018 | $1,164 | $87,485 | $1,428 | $86,057 |
| 2017 | $2,409 | $87,485 | $1,428 | $86,057 |
| 2016 | $2,139 | $77,671 | $1,428 | $76,243 |
| 2015 | $623 | $68,774 | $1,428 | $67,346 |
| 2014 | $623 | $35,000 | $1,428 | $33,572 |
Source: Public Records
Map
Nearby Homes
- 13530 Sharpbill Dr
- 7315 Puerta Vallarta Dr
- 13527 Avonshire Dr
- 6934 Caddo Lake Ln
- 6930 Caddo Lake Ln
- 6855 Caddo Lake Ln
- 13547 Pasa Robles Ln
- 13710 Maximos Dr
- 6823 Wellwood Ct
- 13619 San Martin Ln
- 13707 Matthias Trail
- 13702 Matthias Trail
- 13523 La Concha Ln
- 13206 Sharpbill Dr
- 13207 Robinglen Dr
- 7614 Cortina Dr
- 13522 Carruth Ln
- 13530 Carruth Ln
- 13431 Clarewood Dr
- 7119 Biton Dr
- 13423 Gaby Virbo Dr
- 13421 Gaby Virbo Dr
- 13419 Gaby Virbo Dr
- 13427 Gaby Virbo Dr
- 13417 Gaby Virbo Dr
- 13415 Gaby Virbo Dr
- 13431 Gaby Virbo Dr
- 13514 Catalina Village Dr
- 13518 Catalina Village Dr
- 13522 Catalina Village Dr
- 13435 Gaby Virbo Dr
- 7022 Pouter Dr
- 13526 Catalina Village Dr
- 7019 Puerta Vista Ln
- 13502 Catalina Village Dr
- 13439 Gaby Virbo Dr
- 7018 Pouter Dr
- 13530 Catalina Village Dr
- 7015 Puerta Vista Ln
- 13503 Gaby Virbo Dr