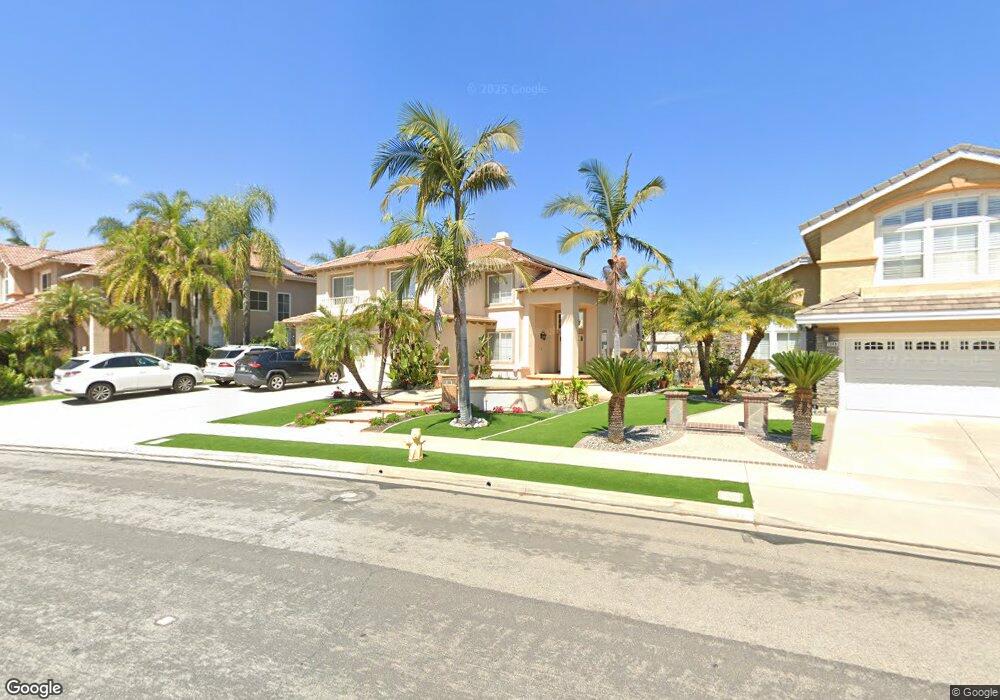
1343 Garten Dr Placentia, CA 92870
Estimated Value: $1,336,027 - $1,555,000
5
Beds
3
Baths
2,631
Sq Ft
$562/Sq Ft
Est. Value
About This Home
This home is located at 1343 Garten Dr, Placentia, CA 92870 and is currently estimated at $1,478,507, approximately $561 per square foot. 1343 Garten Dr is a home located in Orange County with nearby schools including Van Buren Elementary School, Kraemer Middle School, and Valencia High School.
Ownership History
Date
Name
Owned For
Owner Type
Purchase Details
Closed on
May 10, 2024
Sold by
Do Bryan A and Do Cecilia Phuong
Bought by
Do Family Trust and Do
Current Estimated Value
Purchase Details
Closed on
Sep 29, 2000
Sold by
Dasig Orlando A and Dasig Lilian V
Bought by
Do Bryan A and Do Cecilia Phuong
Home Financials for this Owner
Home Financials are based on the most recent Mortgage that was taken out on this home.
Original Mortgage
$333,000
Interest Rate
7.88%
Purchase Details
Closed on
Mar 29, 1995
Sold by
Placentia Brock
Bought by
Dasig Orlando A and Dasig Lilian
Home Financials for this Owner
Home Financials are based on the most recent Mortgage that was taken out on this home.
Original Mortgage
$252,200
Interest Rate
6.25%
Create a Home Valuation Report for This Property
The Home Valuation Report is an in-depth analysis detailing your home's value as well as a comparison with similar homes in the area
Home Values in the Area
Average Home Value in this Area
Purchase History
| Date | Buyer | Sale Price | Title Company |
|---|---|---|---|
| Do Family Trust | -- | None Listed On Document | |
| Do Bryan A | $417,500 | Chicago Title Co | |
| Dasig Orlando A | $280,500 | First American Title Ins Co |
Source: Public Records
Mortgage History
| Date | Status | Borrower | Loan Amount |
|---|---|---|---|
| Previous Owner | Do Bryan A | $333,000 | |
| Previous Owner | Dasig Orlando A | $252,200 |
Source: Public Records
Tax History Compared to Growth
Tax History
| Year | Tax Paid | Tax Assessment Tax Assessment Total Assessment is a certain percentage of the fair market value that is determined by local assessors to be the total taxable value of land and additions on the property. | Land | Improvement |
|---|---|---|---|---|
| 2025 | $7,517 | $628,588 | $210,274 | $418,314 |
| 2024 | $7,517 | $616,263 | $206,151 | $410,112 |
| 2023 | $7,363 | $604,180 | $202,109 | $402,071 |
| 2022 | $7,259 | $592,334 | $198,146 | $394,188 |
| 2021 | $7,091 | $580,720 | $194,261 | $386,459 |
| 2020 | $7,112 | $574,766 | $192,269 | $382,497 |
| 2019 | $6,836 | $563,497 | $188,499 | $374,998 |
| 2018 | $6,749 | $552,449 | $184,803 | $367,646 |
| 2017 | $6,637 | $541,617 | $181,179 | $360,438 |
| 2016 | $6,506 | $530,998 | $177,627 | $353,371 |
| 2015 | $6,425 | $523,022 | $174,958 | $348,064 |
| 2014 | $8,266 | $512,777 | $171,531 | $341,246 |
Source: Public Records
Map
Nearby Homes
- 704 Mcfadden St
- 718 Olivier Dr
- 714 Olivier Dr
- 726 Olivier Dr
- 732 Olivier Dr
- 727 Olivier Dr
- 582 Mcfadden St
- 707 Olivier Dr
- 653 Patten Ave
- 625 Patten Ave
- Elina Plan at Vista Rose
- Lyda Plan at Vista Rose
- Prairie Plan at Vista Rose
- Gallica Plan at Vista Rose
- 5418 Saratoga St
- 1551 E Ray Dr
- 1524 Larsen Ln
- 1527 Evans Ln
- 1270 E Providence Loop
- 1259 E Providence Loop