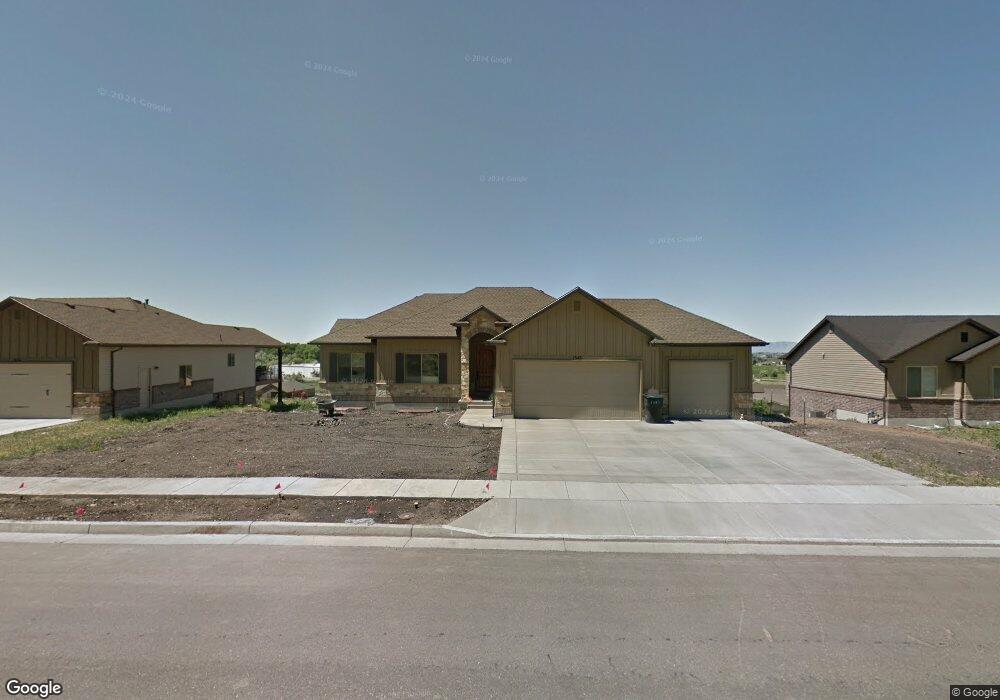
1343 N Highland Blvd Unit 6 Brigham City, UT 84302
Estimated Value: $561,000 - $714,000
3
Beds
2
Baths
1,554
Sq Ft
$397/Sq Ft
Est. Value
About This Home
This home is located at 1343 N Highland Blvd Unit 6, Brigham City, UT 84302 and is currently estimated at $616,500, approximately $396 per square foot. 1343 N Highland Blvd Unit 6 is a home located in Box Elder County with nearby schools including Box Elder Middle School, Adele C. Young Intermediate School, and Box Elder High School.
Ownership History
Date
Name
Owned For
Owner Type
Purchase Details
Closed on
Jul 8, 2015
Sold by
Nielsen Hank
Bought by
Nielsen Misti L
Current Estimated Value
Purchase Details
Closed on
Oct 4, 2013
Sold by
Richens Lee J
Bought by
Richens Lee J and Richens Mandi Rose
Purchase Details
Closed on
Jan 11, 2013
Sold by
Remodel West Inc
Bought by
Nielsen Hank and Nielsen Misti L
Home Financials for this Owner
Home Financials are based on the most recent Mortgage that was taken out on this home.
Original Mortgage
$242,250
Outstanding Balance
$167,726
Interest Rate
3.28%
Mortgage Type
New Conventional
Estimated Equity
$448,774
Purchase Details
Closed on
Jan 4, 2013
Sold by
Willard Bay Ranch Inc
Bought by
Remodel West Inc
Home Financials for this Owner
Home Financials are based on the most recent Mortgage that was taken out on this home.
Original Mortgage
$242,250
Outstanding Balance
$167,726
Interest Rate
3.28%
Mortgage Type
New Conventional
Estimated Equity
$448,774
Purchase Details
Closed on
Sep 10, 2012
Sold by
Kotter Subdivision Llc
Bought by
Willard Bay Ranch Inc
Create a Home Valuation Report for This Property
The Home Valuation Report is an in-depth analysis detailing your home's value as well as a comparison with similar homes in the area
Home Values in the Area
Average Home Value in this Area
Purchase History
| Date | Buyer | Sale Price | Title Company |
|---|---|---|---|
| Nielsen Misti L | -- | None Available | |
| Richens Lee J | -- | None Available | |
| Nielsen Hank | -- | Eagle Gate Title Ins Agency | |
| Remodel West Inc | -- | Eagle Gate Title Ins Ag | |
| Willard Bay Ranch Inc | -- | None Available |
Source: Public Records
Mortgage History
| Date | Status | Borrower | Loan Amount |
|---|---|---|---|
| Open | Nielsen Hank | $242,250 |
Source: Public Records
Tax History Compared to Growth
Tax History
| Year | Tax Paid | Tax Assessment Tax Assessment Total Assessment is a certain percentage of the fair market value that is determined by local assessors to be the total taxable value of land and additions on the property. | Land | Improvement |
|---|---|---|---|---|
| 2025 | $3,148 | $611,473 | $120,000 | $491,473 |
| 2024 | $3,148 | $606,114 | $115,000 | $491,114 |
| 2023 | $3,606 | $710,706 | $105,000 | $605,706 |
| 2022 | $3,086 | $311,051 | $34,375 | $276,676 |
| 2021 | $2,624 | $399,268 | $62,500 | $336,768 |
| 2020 | $2,458 | $399,268 | $62,500 | $336,768 |
| 2019 | $2,294 | $198,289 | $34,375 | $163,914 |
| 2018 | $2,058 | $176,909 | $34,375 | $142,534 |
| 2017 | $1,760 | $261,997 | $24,750 | $216,997 |
| 2016 | $1,839 | $138,415 | $24,750 | $113,665 |
| 2015 | $1,711 | $128,082 | $24,750 | $103,332 |
| 2014 | $1,711 | $124,012 | $24,750 | $99,262 |
| 2013 | -- | $124,012 | $24,750 | $99,262 |
Source: Public Records
Map
Nearby Homes
- 1321 N Highland Blvd
- 1274 N 250 Res E
- 1389 Kotter Dr Unit 47
- 1243 Kotter Dr
- 1206 N 100 E
- 44 E 1300 N
- 142 W 950 N Unit 5
- 315 E 900 N
- 96 W 950 N Unit 2
- 226 925 N
- 130 W 950 N Unit 4
- Saddlewood Plan at North Point - Brigham City
- Westminster Plan at North Point - Brigham City
- Sitka Plan at North Point - Brigham City (Townhomes)
- Stonebrook Plan at North Point - Brigham City
- Greystone Plan at North Point - Brigham City
- Madison Plan at North Point - Brigham City
- 154 W 950 N Unit 6
- 81 W 925 N
- 324 950 N
- 1343 N Highland Blvd
- 1365 N Highland Blvd Unit 5
- 1321 N Highland Blvd Unit 7
- 355 E 1300 N Unit 8
- 355 E 1300 N
- 2216 S 700 W
- 1340 N Highway 38 Unit 69
- 1397 N Highland Blvd Unit 4
- 329 E 1300 N
- 329 E 1300 N Unit 9
- 1352 N Highland Blvd Unit 41
- 1352 N Highland Blvd
- 1318 N Highland Blvd Unit 40
- 1318 N Highland Blvd
- 1386 N Highland Blvd
- 1386 N Highland Blvd Unit 42
- 307 E 1300 N
- 307 E 1300 N Unit 10
- 388 E 1300 N Unit 16
- 374 E 1300 N Unit 15