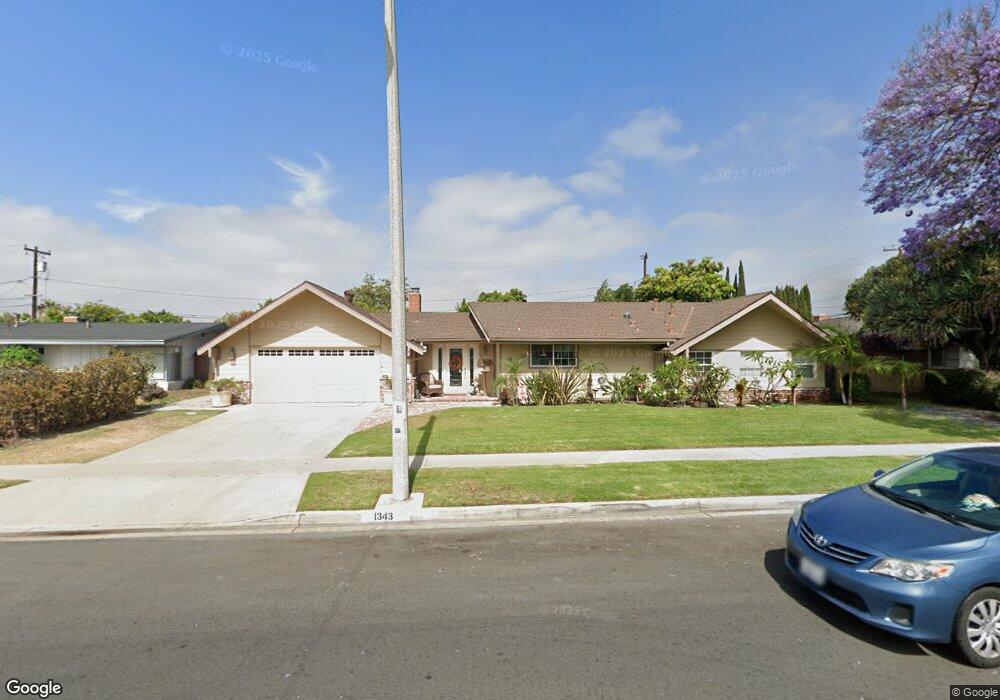
1343 S Hacienda St Anaheim, CA 92804
Hermosa Village NeighborhoodEstimated Value: $918,000 - $1,019,000
3
Beds
2
Baths
1,509
Sq Ft
$637/Sq Ft
Est. Value
About This Home
This home is located at 1343 S Hacienda St, Anaheim, CA 92804 and is currently estimated at $961,330, approximately $637 per square foot. 1343 S Hacienda St is a home located in Orange County with nearby schools including James Madison Elementary School, Ball Junior High School, and Loara High School.
Ownership History
Date
Name
Owned For
Owner Type
Purchase Details
Closed on
Jun 18, 2019
Sold by
Jean Paul Robert and Jean Paul Grace
Bought by
Paul Robert and Paul Grace J
Current Estimated Value
Purchase Details
Closed on
Nov 25, 1997
Sold by
Hromadka Laura E
Bought by
Hromadka Theodore
Home Financials for this Owner
Home Financials are based on the most recent Mortgage that was taken out on this home.
Original Mortgage
$132,800
Interest Rate
7.19%
Purchase Details
Closed on
Nov 3, 1997
Sold by
Hromadka Theodore V
Bought by
Paul Robert and Paul Grace J
Home Financials for this Owner
Home Financials are based on the most recent Mortgage that was taken out on this home.
Original Mortgage
$132,800
Interest Rate
7.19%
Purchase Details
Closed on
Sep 9, 1997
Sold by
Hromadka Theodore V Ii & Hromadka Trust
Bought by
Hromadka Ii Theodore
Home Financials for this Owner
Home Financials are based on the most recent Mortgage that was taken out on this home.
Original Mortgage
$132,800
Interest Rate
7.19%
Create a Home Valuation Report for This Property
The Home Valuation Report is an in-depth analysis detailing your home's value as well as a comparison with similar homes in the area
Home Values in the Area
Average Home Value in this Area
Purchase History
| Date | Buyer | Sale Price | Title Company |
|---|---|---|---|
| Paul Robert | -- | None Available | |
| Hromadka Theodore | -- | North American Title Co | |
| Paul Robert | $166,000 | North American Title Co | |
| Hromadka Ii Theodore | $185,454 | -- |
Source: Public Records
Mortgage History
| Date | Status | Borrower | Loan Amount |
|---|---|---|---|
| Closed | Paul Robert | $132,800 |
Source: Public Records
Tax History Compared to Growth
Tax History
| Year | Tax Paid | Tax Assessment Tax Assessment Total Assessment is a certain percentage of the fair market value that is determined by local assessors to be the total taxable value of land and additions on the property. | Land | Improvement |
|---|---|---|---|---|
| 2025 | $3,246 | $265,051 | $160,401 | $104,650 |
| 2024 | $3,246 | $259,854 | $157,255 | $102,599 |
| 2023 | $3,176 | $254,759 | $154,171 | $100,588 |
| 2022 | $3,133 | $249,764 | $151,148 | $98,616 |
| 2021 | $3,137 | $244,867 | $148,184 | $96,683 |
| 2020 | $3,123 | $242,357 | $146,665 | $95,692 |
| 2019 | $3,034 | $237,605 | $143,789 | $93,816 |
| 2018 | $2,973 | $232,947 | $140,970 | $91,977 |
| 2017 | $2,860 | $228,380 | $138,206 | $90,174 |
| 2016 | $2,851 | $223,902 | $135,496 | $88,406 |
| 2015 | $2,825 | $220,539 | $133,460 | $87,079 |
| 2014 | $2,657 | $216,219 | $130,845 | $85,374 |
Source: Public Records
Map
Nearby Homes
- 1944 W Lullaby Ln
- 1768 W Juno Ave
- 1700 W Cerritos Ave Unit 216
- 930 S Emerald St
- 1350 S Ashington Ln
- 1675 W Mells Ln
- 906 S Fann St
- 1913 W Beacon Ave
- 902 S Fann St
- 1250 S Brookhurst St Unit 1059
- 1250 S Brookhurst St Unit 2028
- 1250 S Brookhurst St Unit 2080
- 1250 S Brookhurst St
- 1250 S Brookhurst St Unit 2033
- 1645 S Euclid St
- 1629 W Ball Rd
- 1616 S Euclid St Unit 100
- 1616 S Euclid St Unit 75
- 1616 S Euclid St Unit 54
- 1616 S Euclid St Unit 23
- 1349 S Hacienda St
- 1339 S Hacienda St
- 1342 S Easy Way
- 1346 S Easy Way
- 1350 S Easy Way
- 1355 S Hacienda St
- 1340 S Hacienda St
- 1350 S Hacienda St
- 1840 W Chalet Ave
- 1338 S Easy Way
- 1846 W Chalet Ave
- 1356 S Easy Way
- 1830 W Chalet Ave
- 1358 S Hacienda St
- 1823 W Palais Rd
- 1361 S Hacienda St
- 1822 W Palais Rd
- 1852 W Chalet Ave
- 1343 S Easy Way
- 1347 S Easy Way