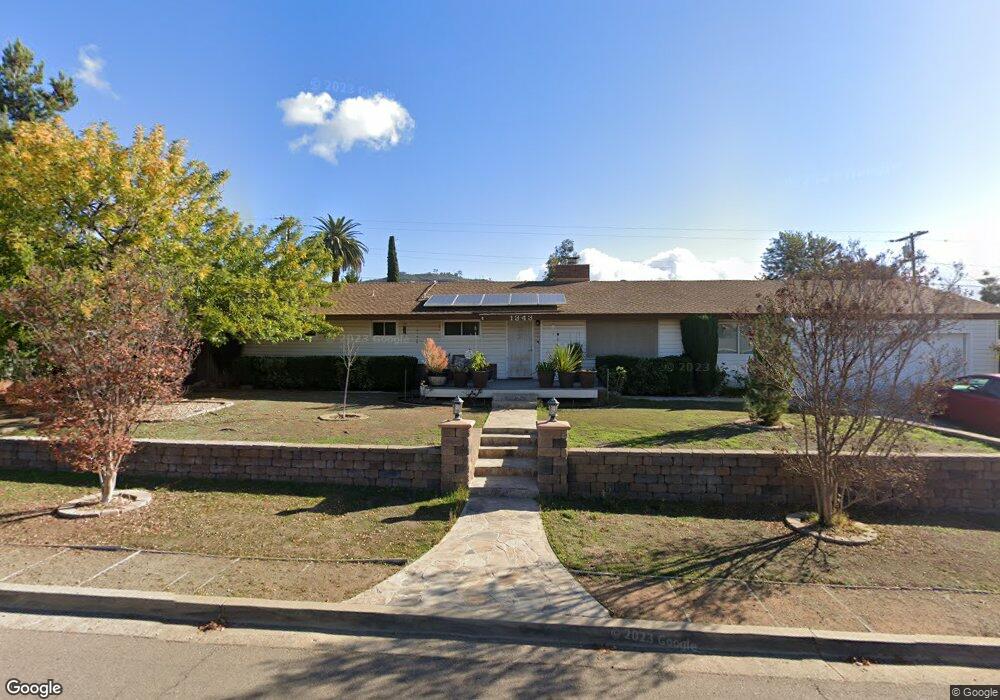
1343 Vulcan St El Cajon, CA 92021
Bostonia NeighborhoodEstimated Value: $841,586 - $978,000
5
Beds
3
Baths
2,105
Sq Ft
$436/Sq Ft
Est. Value
About This Home
This home is located at 1343 Vulcan St, El Cajon, CA 92021 and is currently estimated at $917,897, approximately $436 per square foot. 1343 Vulcan St is a home located in San Diego County with nearby schools including Pepper Drive Elementary School, Santana High School, and Grossmont Secondary School.
Ownership History
Date
Name
Owned For
Owner Type
Purchase Details
Closed on
Jul 1, 2014
Sold by
Rainey Floyd D and Rainey Paula K
Bought by
The 2014 Rainey Family Trust
Current Estimated Value
Purchase Details
Closed on
Sep 4, 2001
Sold by
Rainey Floyd D and Rainey Paula K
Bought by
Rainey Floyd D and Rainey Paula K
Home Financials for this Owner
Home Financials are based on the most recent Mortgage that was taken out on this home.
Original Mortgage
$160,000
Interest Rate
7.05%
Purchase Details
Closed on
Aug 30, 2001
Sold by
Rainey Floyd D and Rainey Paula K
Bought by
Rainey Floyd D and Rainey Paula K
Home Financials for this Owner
Home Financials are based on the most recent Mortgage that was taken out on this home.
Original Mortgage
$160,000
Interest Rate
7.05%
Purchase Details
Closed on
Mar 4, 2001
Sold by
Rainey Floyd D and Rainey Paula K
Bought by
Rainey Floyd D and Rainey Paula K
Create a Home Valuation Report for This Property
The Home Valuation Report is an in-depth analysis detailing your home's value as well as a comparison with similar homes in the area
Home Values in the Area
Average Home Value in this Area
Purchase History
| Date | Buyer | Sale Price | Title Company |
|---|---|---|---|
| The 2014 Rainey Family Trust | -- | None Available | |
| Rainey Floyd D | -- | None Available | |
| Rainey Floyd D | -- | -- | |
| Rainey Floyd D | -- | American Title | |
| Rainey Floyd D | -- | -- |
Source: Public Records
Mortgage History
| Date | Status | Borrower | Loan Amount |
|---|---|---|---|
| Previous Owner | Rainey Floyd D | $160,000 |
Source: Public Records
Tax History Compared to Growth
Tax History
| Year | Tax Paid | Tax Assessment Tax Assessment Total Assessment is a certain percentage of the fair market value that is determined by local assessors to be the total taxable value of land and additions on the property. | Land | Improvement |
|---|---|---|---|---|
| 2025 | $1,872 | $159,447 | $25,841 | $133,606 |
| 2024 | $1,872 | $156,322 | $25,335 | $130,987 |
| 2023 | $1,811 | $153,258 | $24,839 | $128,419 |
| 2022 | $1,794 | $150,253 | $24,352 | $125,901 |
| 2021 | $1,771 | $147,308 | $23,875 | $123,433 |
| 2020 | $1,752 | $145,799 | $23,631 | $122,168 |
| 2019 | $1,693 | $142,941 | $23,168 | $119,773 |
| 2018 | $1,657 | $140,139 | $22,714 | $117,425 |
| 2017 | $1,633 | $137,392 | $22,269 | $115,123 |
| 2016 | $1,581 | $134,699 | $21,833 | $112,866 |
| 2015 | $1,552 | $132,677 | $21,506 | $111,171 |
| 2014 | $1,520 | $130,079 | $21,085 | $108,994 |
Source: Public Records
Map
Nearby Homes
- 1407 Cascade Place
- 1772 Summertime Dr
- 1652 Summertime Dr
- 1701 Summertime Dr
- 8445 Graves Ave Unit 1
- 309 Sun Ct
- 411 Danny St
- 321 Sun Ct
- 260 E Bradley Ave
- 260 E Bradley Ave Unit SPC 51
- 1673 Stone Edge Cir
- 5120 Sevilla St
- 450 E Bradley Ave Unit 115
- 450 E Bradley Ave Unit 127
- 450 E Bradley Ave Unit 36
- 450 E Bradley Ave Unit 144
- 450 E Bradley Ave Unit 157
- 450 E Bradley Ave Unit 80
- 450 E Bradley Ave Unit 106
- 450 E Bradley Ave Unit 18
- 1351 Vulcan St
- 1335 Vulcan St
- 1328 Roxanne Dr
- 1336 Roxanne Dr
- 1342 Vulcan St
- 1320 Roxanne Dr
- 1344 Roxanne Dr
- 1348 Vulcan St
- 1334 Vulcan St
- 1359 Vulcan St
- 1312 Roxanne Dr
- 1352 Roxanne Dr
- 1341 Teton Dr
- 1347 Teton Dr
- 1360 Roxanne Dr
- 1367 Vulcan St
- 1355 Teton Dr
- 1329 Roxanne Dr
- 1337 Roxanne Dr
- 1304 Roxanne Dr