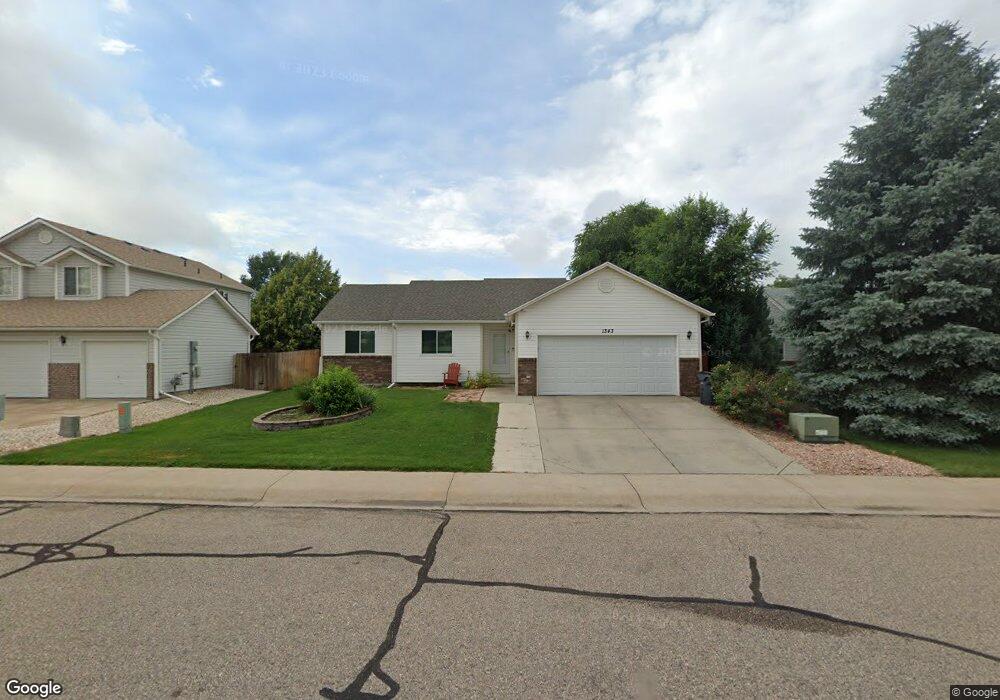
1343 Westwood Dr Windsor, CO 80550
Estimated Value: $454,052 - $478,000
3
Beds
3
Baths
1,295
Sq Ft
$360/Sq Ft
Est. Value
About This Home
This home is located at 1343 Westwood Dr, Windsor, CO 80550 and is currently estimated at $465,763, approximately $359 per square foot. 1343 Westwood Dr is a home located in Weld County with nearby schools including Skyview Elementary School, Windsor Middle School, and Windsor High School.
Ownership History
Date
Name
Owned For
Owner Type
Purchase Details
Closed on
Sep 8, 2003
Sold by
Jacoby Mark A
Bought by
Jacoby Mark A and Jacoby Kristen
Current Estimated Value
Home Financials for this Owner
Home Financials are based on the most recent Mortgage that was taken out on this home.
Original Mortgage
$167,200
Outstanding Balance
$76,282
Interest Rate
6%
Mortgage Type
Unknown
Estimated Equity
$389,481
Purchase Details
Closed on
Jan 27, 2002
Sold by
Zimmer Jill R
Bought by
Jacoby Mark A
Home Financials for this Owner
Home Financials are based on the most recent Mortgage that was taken out on this home.
Original Mortgage
$180,000
Interest Rate
6.5%
Purchase Details
Closed on
Apr 28, 1998
Sold by
Executive Homes Inc
Bought by
Jacoby Mark A and Zimmer Jill R
Home Financials for this Owner
Home Financials are based on the most recent Mortgage that was taken out on this home.
Original Mortgage
$121,765
Interest Rate
7.09%
Create a Home Valuation Report for This Property
The Home Valuation Report is an in-depth analysis detailing your home's value as well as a comparison with similar homes in the area
Home Values in the Area
Average Home Value in this Area
Purchase History
| Date | Buyer | Sale Price | Title Company |
|---|---|---|---|
| Jacoby Mark A | -- | -- | |
| Jacoby Mark A | -- | -- | |
| Jacoby Mark A | $128,175 | -- |
Source: Public Records
Mortgage History
| Date | Status | Borrower | Loan Amount |
|---|---|---|---|
| Open | Jacoby Mark A | $167,200 | |
| Closed | Jacoby Mark A | $180,000 | |
| Previous Owner | Jacoby Mark A | $121,765 | |
| Closed | Jacoby Mark A | $41,800 |
Source: Public Records
Tax History Compared to Growth
Tax History
| Year | Tax Paid | Tax Assessment Tax Assessment Total Assessment is a certain percentage of the fair market value that is determined by local assessors to be the total taxable value of land and additions on the property. | Land | Improvement |
|---|---|---|---|---|
| 2025 | $2,416 | $27,970 | $6,440 | $21,530 |
| 2024 | $2,416 | $27,970 | $6,440 | $21,530 |
| 2023 | $2,218 | $29,180 | $5,140 | $24,040 |
| 2022 | $2,088 | $21,420 | $5,210 | $16,210 |
| 2021 | $1,947 | $22,040 | $5,360 | $16,680 |
| 2020 | $1,866 | $21,540 | $5,010 | $16,530 |
| 2019 | $1,850 | $21,540 | $5,010 | $16,530 |
| 2018 | $1,663 | $18,330 | $3,240 | $15,090 |
| 2017 | $1,760 | $18,330 | $3,240 | $15,090 |
| 2016 | $1,608 | $16,910 | $3,180 | $13,730 |
| 2015 | $1,496 | $16,910 | $3,180 | $13,730 |
| 2014 | $1,315 | $13,940 | $2,710 | $11,230 |
Source: Public Records
Map
Nearby Homes
- 1507 Stonewood Ct
- 1501 Driftwood Ct
- 515 Trailwood Cir
- 1538 Wedgewood Ct
- 1421 Canal Dr
- 1107 Crescent Dr
- 904 Pine Dr
- 1116 Grand Ave
- 813 Walnut St
- 1625 Main St
- 1228 Fairfield Ave
- 1208 Fairfield Ave
- Summit Plan at Trevenna
- 1050 Fairfield Ave
- 1604 Sorenson Dr
- 610 Oak St
- Regent - Premier Plan at Trevenna
- Kensington - Premier Plan at Trevenna
- St. James - Premier Plan at Trevenna
- Charleston - Premier Plan at Trevenna
- 1329 Westwood Dr
- 1357 Westwood Dr
- 1374 Keywood Ct
- 1368 Keywood Ct
- 1315 Westwood Dr
- 1371 Westwood Dr
- 1380 Keywood Ct
- 1386 Keywood Ct
- 1301 Westwood Dr
- 1362 Keywood Ct
- 1385 Westwood Dr
- 1392 Keywood Ct
- 1239 Westwood Dr
- 401 14th St
- 1356 Keywood Ct
- 403 14th St
- 1373 Keywood Ct
- 1379 Keywood Ct
- 1385 Keywood Ct
- 1240 Westwood Dr