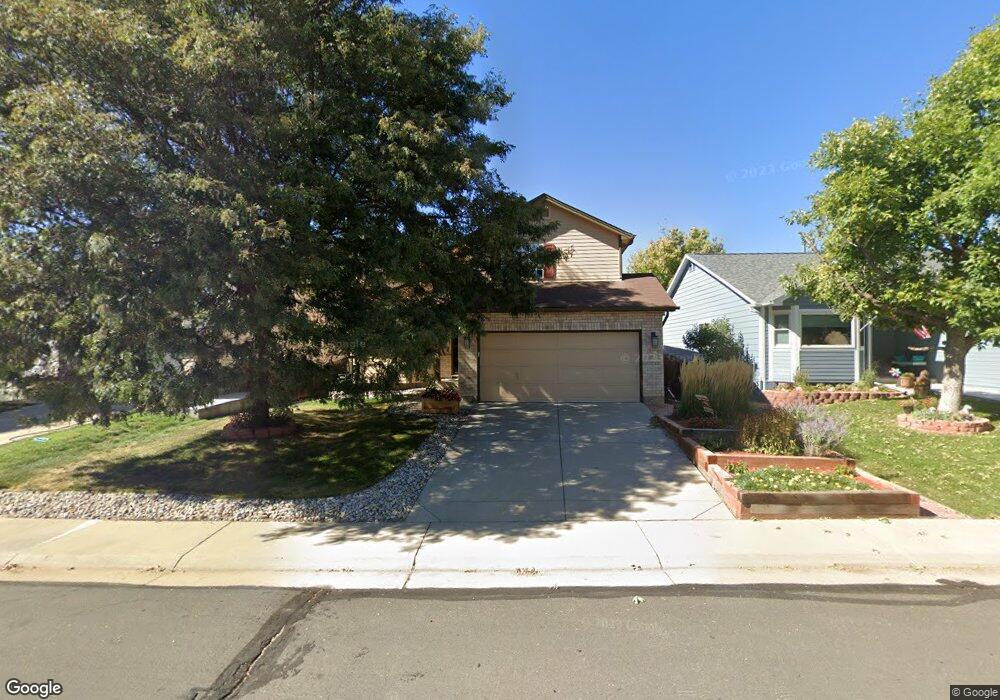
13435 Cherry Way Thornton, CO 80241
Estimated Value: $512,000 - $583,000
4
Beds
3
Baths
1,897
Sq Ft
$283/Sq Ft
Est. Value
About This Home
This home is located at 13435 Cherry Way, Thornton, CO 80241 and is currently estimated at $536,034, approximately $282 per square foot. 13435 Cherry Way is a home located in Adams County with nearby schools including Eagleview Elementary School, Rocky Top Middle School, and Horizon High School.
Ownership History
Date
Name
Owned For
Owner Type
Purchase Details
Closed on
Jan 26, 2021
Sold by
Genz Marlisa K
Bought by
Marlisa K Genz Trusts
Current Estimated Value
Purchase Details
Closed on
Apr 28, 2005
Sold by
Li Hong and Gu Hong
Bought by
Genz Marlisa K
Home Financials for this Owner
Home Financials are based on the most recent Mortgage that was taken out on this home.
Original Mortgage
$198,400
Outstanding Balance
$102,215
Interest Rate
6.06%
Mortgage Type
Stand Alone First
Estimated Equity
$433,819
Purchase Details
Closed on
Apr 23, 1999
Sold by
Melody Homes Inc
Bought by
Gu Hong and Li Hong
Home Financials for this Owner
Home Financials are based on the most recent Mortgage that was taken out on this home.
Original Mortgage
$158,600
Interest Rate
7.16%
Create a Home Valuation Report for This Property
The Home Valuation Report is an in-depth analysis detailing your home's value as well as a comparison with similar homes in the area
Purchase History
| Date | Buyer | Sale Price | Title Company |
|---|---|---|---|
| Marlisa K Genz Trusts | -- | None Available | |
| Genz Marlisa K | $248,000 | American Liberty Title | |
| Gu Hong | $176,252 | Land Title |
Source: Public Records
Mortgage History
| Date | Status | Borrower | Loan Amount |
|---|---|---|---|
| Open | Genz Marlisa K | $198,400 | |
| Previous Owner | Gu Hong | $158,600 | |
| Closed | Genz Marlisa K | $24,800 |
Source: Public Records
Tax History
| Year | Tax Paid | Tax Assessment Tax Assessment Total Assessment is a certain percentage of the fair market value that is determined by local assessors to be the total taxable value of land and additions on the property. | Land | Improvement |
|---|---|---|---|---|
| 2025 | $3,572 | $35,900 | $7,480 | $28,420 |
| 2024 | $3,572 | $33,010 | $6,880 | $26,130 |
| 2023 | $3,535 | $38,220 | $6,490 | $31,730 |
| 2022 | $2,948 | $26,760 | $6,670 | $20,090 |
| 2021 | $3,046 | $26,760 | $6,670 | $20,090 |
| 2020 | $2,898 | $25,980 | $6,860 | $19,120 |
| 2019 | $2,904 | $25,980 | $6,860 | $19,120 |
| 2018 | $2,602 | $22,610 | $6,480 | $16,130 |
| 2017 | $2,366 | $22,610 | $6,480 | $16,130 |
| 2016 | $2,009 | $18,690 | $3,820 | $14,870 |
| 2015 | $2,006 | $18,690 | $3,820 | $14,870 |
| 2014 | $1,900 | $17,210 | $3,500 | $13,710 |
Source: Public Records
Map
Nearby Homes
- 13212 Clermont Cir
- 13222 Clermont Cir
- 4087 E 133rd Cir
- 0 Colorado Blvd
- 13686 Dexter St
- 3867 E 133rd Ct
- 4756 E 129th Place
- 13068 Harrison Dr
- 13271 Holly St Unit B
- 13064 Harrison Dr
- 12993 Birch Dr
- 13608 Garfield St Unit D
- 13638 Garfield St Unit C
- 13604 Garfield St Unit E
- 5341 E 129th Way
- 13055 Harrison Dr
- 13004 Harrison Dr
- 13488 Monroe St
- 13064 Garfield Dr
- 5375 E 128th Dr
- 13445 Cherry Way
- 13425 Cherry Way
- 13442 Cherry Ct
- 13455 Cherry Way
- 13432 Cherry Ct
- 13452 Cherry Ct
- 13415 Cherry Way
- 13424 Cherry Way
- 13422 Cherry Ct
- 13434 Cherry Way
- 13465 Cherry Way
- 13444 Cherry Way
- 13462 Cherry Ct
- 13475 Cherry Way
- 13412 Cherry Ct
- 13454 Cherry Way
- 13427 Dexter Way
- 13464 Cherry Way
- 13472 Cherry Ct
- 13437 Dexter Way
Your Personal Tour Guide
Ask me questions while you tour the home.