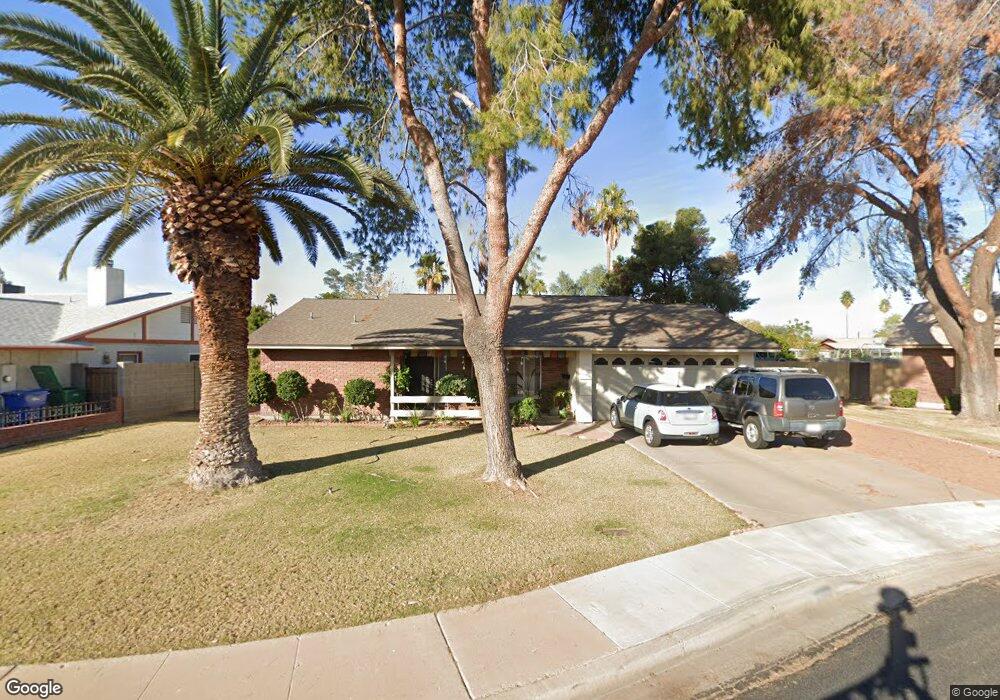
1344 S Glenview Cir Mesa, AZ 85204
Central Mesa NeighborhoodEstimated Value: $349,266 - $448,000
Studio
2
Baths
1,318
Sq Ft
$308/Sq Ft
Est. Value
About This Home
This home is located at 1344 S Glenview Cir, Mesa, AZ 85204 and is currently estimated at $406,067, approximately $308 per square foot. 1344 S Glenview Cir is a home located in Maricopa County with nearby schools including Porter Elementary School, Franklin at Brimhall Elementary School, and Franklin West Elementary School.
Ownership History
Date
Name
Owned For
Owner Type
Purchase Details
Closed on
Nov 23, 1998
Sold by
Bowlin Robin J
Bought by
Tyndall Tom A
Current Estimated Value
Purchase Details
Closed on
Nov 10, 1998
Sold by
Moore Jeremy S and Moore Kari H
Bought by
Tyndall Tom A
Purchase Details
Closed on
Aug 14, 1996
Sold by
Garcia Deanie L and Nelson Deanie L
Bought by
Moore Jeremy S and Moore Kari H
Home Financials for this Owner
Home Financials are based on the most recent Mortgage that was taken out on this home.
Original Mortgage
$91,065
Interest Rate
8.23%
Mortgage Type
FHA
Purchase Details
Closed on
Feb 8, 1994
Sold by
Shroyer Richard L and Shroyer Donna M
Bought by
Nelson Deanie L
Home Financials for this Owner
Home Financials are based on the most recent Mortgage that was taken out on this home.
Original Mortgage
$74,160
Interest Rate
7.15%
Mortgage Type
FHA
Create a Home Valuation Report for This Property
The Home Valuation Report is an in-depth analysis detailing your home's value as well as a comparison with similar homes in the area
Home Values in the Area
Average Home Value in this Area
Purchase History
| Date | Buyer | Sale Price | Title Company |
|---|---|---|---|
| Tyndall Tom A | -- | Transnation Title Insurance | |
| Tyndall Tom A | $103,000 | Transnation Title Insurance | |
| Moore Jeremy S | $91,500 | Transnation Title Ins Co | |
| Nelson Deanie L | $74,000 | Security Title Agency |
Source: Public Records
Mortgage History
| Date | Status | Borrower | Loan Amount |
|---|---|---|---|
| Previous Owner | Moore Jeremy S | $91,065 | |
| Previous Owner | Nelson Deanie L | $74,160 |
Source: Public Records
Tax History
| Year | Tax Paid | Tax Assessment Tax Assessment Total Assessment is a certain percentage of the fair market value that is determined by local assessors to be the total taxable value of land and additions on the property. | Land | Improvement |
|---|---|---|---|---|
| 2025 | $1,152 | $13,866 | -- | -- |
| 2024 | $1,164 | $13,205 | -- | -- |
| 2023 | $1,164 | $29,130 | $5,820 | $23,310 |
| 2022 | $1,139 | $22,270 | $4,450 | $17,820 |
| 2021 | $1,170 | $21,150 | $4,230 | $16,920 |
| 2020 | $1,154 | $19,350 | $3,870 | $15,480 |
| 2019 | $1,069 | $17,220 | $3,440 | $13,780 |
| 2018 | $1,021 | $15,800 | $3,160 | $12,640 |
| 2017 | $989 | $14,220 | $2,840 | $11,380 |
| 2016 | $971 | $14,830 | $2,960 | $11,870 |
| 2015 | $917 | $12,520 | $2,500 | $10,020 |
Source: Public Records
Map
Nearby Homes
- 1356 S Yale
- 2601 E Hopi Ave
- 1359 S Almond Cir
- 1425 S Lindsay Rd Unit 51
- 1520 S Gaylord
- 2831 E Southern Ave Unit 232
- 2831 E Southern Ave Unit 216
- 2625 E Isabella Ave
- 2649 E Isabella Ave
- 2352 E Florian Cir
- 2765 E El Moro Ave
- 1525 S Chestnut Cir
- 3029 E Garnet Ave
- 3046 E Glade Ave
- 2820 E Inverness Ave
- 2647 E Juanita Ave
- 2403 E Inverness Ave
- 2925 E Impala Ave
- 2452 E Juanita Ave
- 1806 S Los Alamos
- 1356 S Glenview Cir
- 1338 S Glenview Cir
- 1347 S Windsor Cir
- 1359 S Windsor Cir
- 1335 S Windsor Cir
- 1343 S Glenview Cir
- 1355 S Glenview Cir
- 1337 S Glenview Cir
- 2603 E Glade Ave
- 2561 E Hampton Ave
- 2603 E Hampton Ave
- 2607 E Glade Ave
- 2567 E Glade Ave
- 2553 E Hampton Ave
- 2611 E Hampton Ave Unit 2
- 2617 E Glade Ave
- 2563 E Glade Ave
- 1336 S Windsor Cir
- 1360 S Windsor Cir
- 1348 S Yale
Your Personal Tour Guide
Ask me questions while you tour the home.