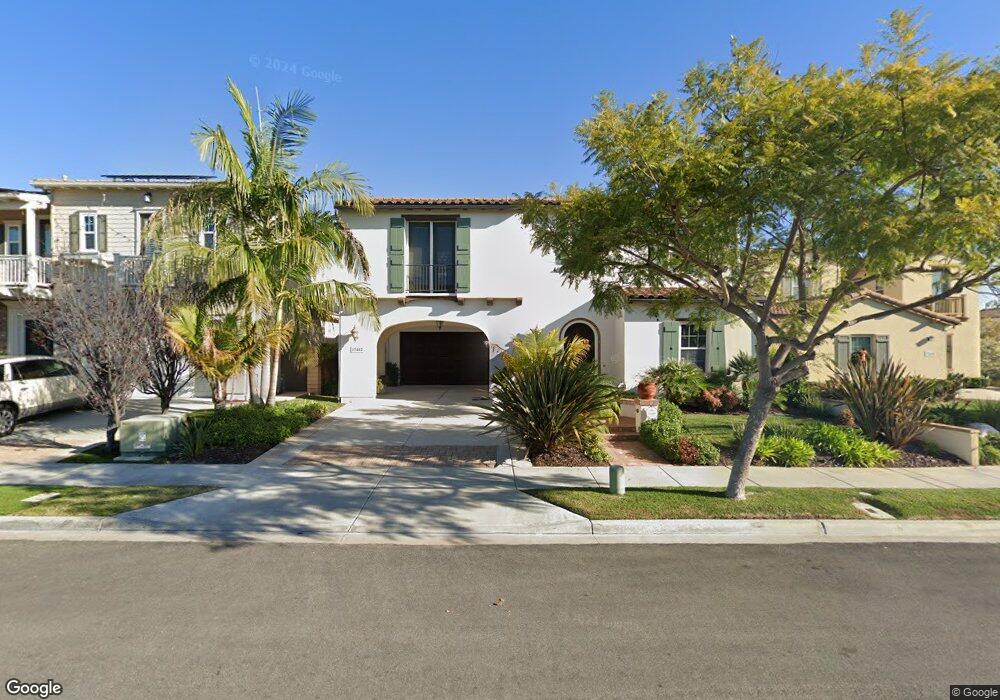
13442 Ginger Glen Rd San Diego, CA 92130
Carmel Valley NeighborhoodEstimated Value: $2,019,000 - $2,743,000
4
Beds
4
Baths
3,187
Sq Ft
$795/Sq Ft
Est. Value
About This Home
This home is located at 13442 Ginger Glen Rd, San Diego, CA 92130 and is currently estimated at $2,533,322, approximately $794 per square foot. 13442 Ginger Glen Rd is a home located in San Diego County with nearby schools including Solana Ranch Elementary School, Pacific Trails Middle, and Torrey Pines High School.
Ownership History
Date
Name
Owned For
Owner Type
Purchase Details
Closed on
Aug 13, 2013
Sold by
Minokadeh Said and Minokadeh Shiva
Bought by
Minokadeh Said and Minokadeh Zohreh Shiva
Current Estimated Value
Purchase Details
Closed on
Nov 11, 2009
Sold by
Swenson Brenda Jo
Bought by
Minokadeh Said and Minokadeh Shiva
Purchase Details
Closed on
Aug 7, 2009
Sold by
Swensor Michael David
Bought by
Swensor Brenda Jo
Purchase Details
Closed on
Mar 3, 2006
Sold by
Pardee Homes
Bought by
Swenson Michael David and Swenson Brenda Jo
Home Financials for this Owner
Home Financials are based on the most recent Mortgage that was taken out on this home.
Original Mortgage
$675,000
Interest Rate
6%
Mortgage Type
Purchase Money Mortgage
Create a Home Valuation Report for This Property
The Home Valuation Report is an in-depth analysis detailing your home's value as well as a comparison with similar homes in the area
Home Values in the Area
Average Home Value in this Area
Purchase History
| Date | Buyer | Sale Price | Title Company |
|---|---|---|---|
| Minokadeh Said | -- | None Available | |
| Minokadeh Said | $1,000,000 | First American Title Company | |
| Swensor Brenda Jo | -- | Chicago Title Company | |
| Swenson Michael David | $984,000 | Chicago Title Co |
Source: Public Records
Mortgage History
| Date | Status | Borrower | Loan Amount |
|---|---|---|---|
| Previous Owner | Swenson Michael David | $675,000 |
Source: Public Records
Tax History Compared to Growth
Tax History
| Year | Tax Paid | Tax Assessment Tax Assessment Total Assessment is a certain percentage of the fair market value that is determined by local assessors to be the total taxable value of land and additions on the property. | Land | Improvement |
|---|---|---|---|---|
| 2025 | $18,207 | $1,290,811 | $567,956 | $722,855 |
| 2024 | $18,207 | $1,265,502 | $556,820 | $708,682 |
| 2023 | $17,905 | $1,240,689 | $545,902 | $694,787 |
| 2022 | $17,678 | $1,216,363 | $535,199 | $681,164 |
| 2021 | $17,434 | $1,192,513 | $524,705 | $667,808 |
| 2020 | $17,318 | $1,180,286 | $519,325 | $660,961 |
| 2019 | $17,067 | $1,157,144 | $509,143 | $648,001 |
| 2018 | $16,827 | $1,134,456 | $499,160 | $635,296 |
| 2017 | $16,634 | $1,112,213 | $489,373 | $622,840 |
| 2016 | $16,252 | $1,090,406 | $479,778 | $610,628 |
| 2015 | $16,099 | $1,074,028 | $472,572 | $601,456 |
| 2014 | $15,896 | $1,052,990 | $463,315 | $589,675 |
Source: Public Records
Map
Nearby Homes
- 5621 Shasta Daisy Trail
- 5582 Valerio Trail
- 13120 Chambord Way
- 13016 Lumen Way
- 5480 Valerio Trail
- 12932 Peppergrass Creek Gate Unit 58
- 5312 Sweetwater Trail
- 13033 Lamia Point Unit 217
- 13032 Alora Point Unit 170
- 5347 Morning Sage Way
- 6265 Silverbush Creek St
- 6222 Artisan Way
- 13233 Petunia Way
- 13348 Camelia Way
- 13165 Caminito Mendiola
- 13441 Banyan Way
- 13625 Winstanley Way
- 13563 Chamise Vista Ln
- 6336 Sagebrush Bend Way
- 14004 Calle Venecia
- 13436 Ginger Glen Rd
- 13448 Ginger Glen Rd
- 13452 Ginger Glen Rd
- 13430 Ginger Glen Rd
- 5757 Aster Meadows Place
- 13458 Ginger Glen Rd
- 5763 Aster Meadows Place
- 5701 Cape Jewels Trail
- 13464 Ginger Glen Rd
- 5769 Aster Meadows Place
- 5707 Cape Jewels Trail
- 13470 Ginger Glen Rd
- 5750 Blazing Star Ln
- 5779 Aster Meadows Place
- 13465 Ginger Glen Rd
- 5762 Aster Meadows Place
- 5713 Cape Jewels Trail
- 13471 Ginger Glen Rd
- 13476 Ginger Glen Rd
- 5770 Aster Meadows Place