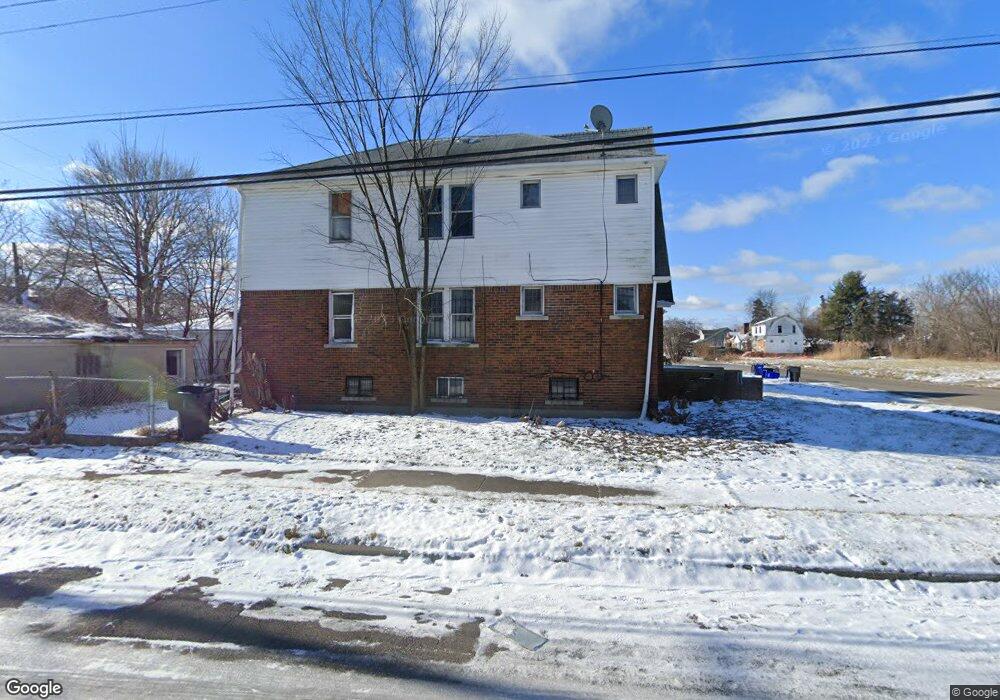
13444 Wilfred St Detroit, MI 48213
Eden Gardens NeighborhoodEstimated Value: $87,000 - $122,000
4
Beds
2
Baths
1,913
Sq Ft
$52/Sq Ft
Est. Value
About This Home
This home is located at 13444 Wilfred St, Detroit, MI 48213 and is currently estimated at $99,776, approximately $52 per square foot. 13444 Wilfred St is a home located in Wayne County with nearby schools including Edward 'Duke' Ellington Conservatory of Music and Art, Charles L. Spain Elementary-Middle School, and Denby High School.
Ownership History
Date
Name
Owned For
Owner Type
Purchase Details
Closed on
Mar 1, 2021
Sold by
Thomas Christine L
Bought by
Moore Kamal Rahim Amin
Current Estimated Value
Purchase Details
Closed on
Nov 11, 2014
Sold by
Treasurer Of The Charter County Of Wayne
Bought by
Allah Mahdi B
Purchase Details
Closed on
Jul 2, 2012
Sold by
Thomas Christine L
Bought by
Folson Brandy L
Purchase Details
Closed on
Jun 28, 2011
Sold by
Pusha Teala
Bought by
Thomas Christine L
Purchase Details
Closed on
Dec 30, 2009
Sold by
Kelel Mark and Kelel Kimberly Anne
Bought by
Central Mortgage Company
Purchase Details
Closed on
Jun 8, 2005
Sold by
Hud
Bought by
Kelel Mark
Purchase Details
Closed on
Jan 18, 2005
Sold by
Mortgage Electronic Registration Systems
Bought by
Hud
Purchase Details
Closed on
Jul 14, 2004
Sold by
Bates Belinda
Bought by
Mortgage Electronic Registration Systems
Create a Home Valuation Report for This Property
The Home Valuation Report is an in-depth analysis detailing your home's value as well as a comparison with similar homes in the area
Home Values in the Area
Average Home Value in this Area
Purchase History
| Date | Buyer | Sale Price | Title Company |
|---|---|---|---|
| Moore Kamal Rahim Amin | $1,000 | None Available | |
| Allah Mahdi B | $500 | None Available | |
| Folson Brandy L | $2,000 | None Available | |
| Thomas Christine L | $2,000 | None Available | |
| Central Mortgage Company | $96,331 | None Available | |
| Kelel Mark | $31,222 | None Available | |
| Hud | -- | -- | |
| Mortgage Electronic Registration Systems | $70,018 | -- |
Source: Public Records
Tax History Compared to Growth
Tax History
| Year | Tax Paid | Tax Assessment Tax Assessment Total Assessment is a certain percentage of the fair market value that is determined by local assessors to be the total taxable value of land and additions on the property. | Land | Improvement |
|---|---|---|---|---|
| 2025 | $1,919 | $37,800 | $0 | $0 |
| 2024 | $1,919 | $33,500 | $0 | $0 |
| 2023 | $2,110 | $26,800 | $0 | $0 |
| 2022 | $1,415 | $21,900 | $0 | $0 |
| 2021 | $1,282 | $16,000 | $0 | $0 |
| 2020 | $1,282 | $15,300 | $0 | $0 |
| 2019 | $1,264 | $13,800 | $0 | $0 |
| 2018 | $1,125 | $11,400 | $0 | $0 |
| 2017 | $189 | $12,700 | $0 | $0 |
| 2016 | $1,221 | $11,700 | $0 | $0 |
| 2015 | $1,170 | $11,700 | $0 | $0 |
| 2013 | $1,623 | $16,226 | $0 | $0 |
| 2010 | -- | $23,789 | $911 | $22,878 |
Source: Public Records
Map
Nearby Homes
- 14258 Glenfield St
- 13380 Kilbourne St
- 13150 Glenfield St
- 13413 Jane St
- 14221 Jane St
- 13312 Jane St
- 13302 Jane St
- 14303 Rosemary St
- 14434 Houston Whittier St
- 14421 Houston Whittier St
- 13004 Wilfred St
- 14166 Mayfield St
- 14756 Rosemary St
- 13388 Wilshire Dr
- 13001 Promenade St
- 13320 Wilshire Dr
- 13310 Wilshire Dr
- 14811 Rosemary St
- 9675 E Outer Dr
- 14851 Alma St
- 13436 Wilfred St
- 14202 Wilfred St
- 13422 Wilfred St
- 13437 Glenfield St
- 14210 Wilfred St
- 13431 Glenfield St
- 14205 Glenfield St
- 13445 Wilfred St
- 13425 Glenfield St
- 13437 Wilfred St
- 14218 Wilfred St
- 14211 Glenfield St
- 14205 Wilfred St
- 14219 Glenfield St
- 13431 Wilfred St
- 13417 Glenfield St
- 14211 Wilfred St
- 14219 Wilfred St
- 13400 Wilfred St
- 14227 Glenfield St