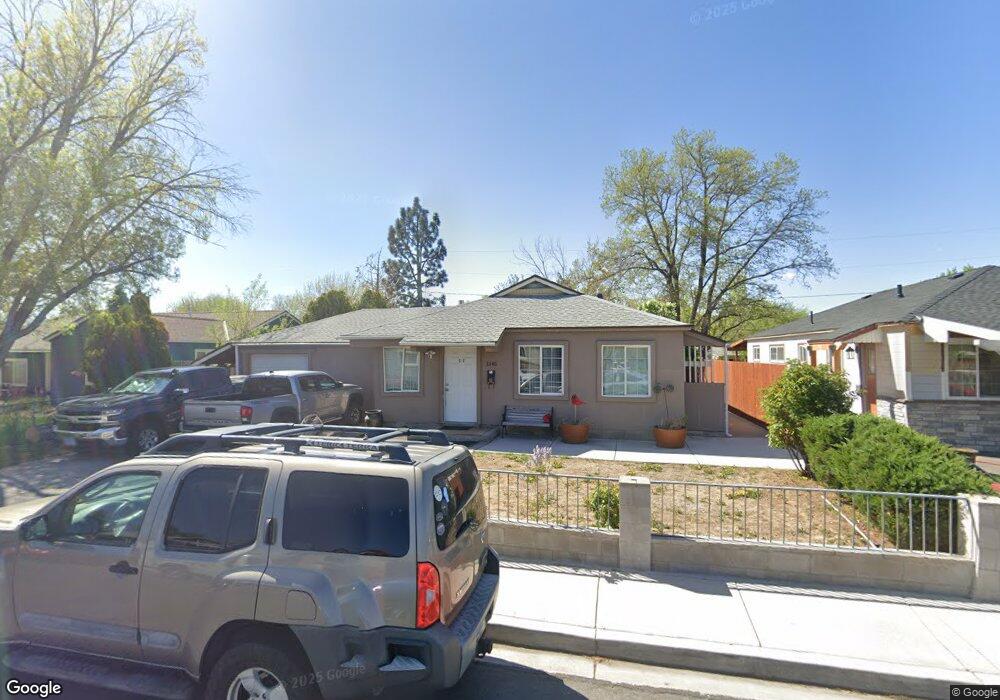
1345 Tyler Way Sparks, NV 89431
North Rock NeighborhoodEstimated Value: $369,434 - $417,000
4
Beds
2
Baths
1,196
Sq Ft
$332/Sq Ft
Est. Value
About This Home
This home is located at 1345 Tyler Way, Sparks, NV 89431 and is currently estimated at $397,609, approximately $332 per square foot. 1345 Tyler Way is a home located in Washoe County with nearby schools including Alice Maxwell Elementary School, Sparks Middle School, and Sparks High School.
Ownership History
Date
Name
Owned For
Owner Type
Purchase Details
Closed on
Nov 22, 2024
Sold by
Rodriguez-Ceballos Maria
Bought by
Gem Family Trust and Rodriguez-Ceballos
Current Estimated Value
Purchase Details
Closed on
Feb 26, 2014
Sold by
Ceballos Eulalio and Diaz Eulalio
Bought by
Rodriguez Ceballos Maria
Purchase Details
Closed on
Mar 30, 2009
Sold by
Ceballos Eulalio
Bought by
Rodriguez Maria
Purchase Details
Closed on
Nov 17, 2004
Sold by
Ceballos Maria Rodriguez and Ceballos Maria
Bought by
Diaz Eulalio Ceballos and Ceballos Maria Rodriguez
Purchase Details
Closed on
May 8, 2002
Sold by
Diaz Eulalio Ceballos
Bought by
Ceballos Maria
Purchase Details
Closed on
May 2, 1995
Sold by
Smith Gregory E and Smith Deborah J
Bought by
Diaz Eulalio Ceballos and Ceballos Maria Rodriguez
Home Financials for this Owner
Home Financials are based on the most recent Mortgage that was taken out on this home.
Original Mortgage
$106,784
Interest Rate
8.44%
Mortgage Type
FHA
Create a Home Valuation Report for This Property
The Home Valuation Report is an in-depth analysis detailing your home's value as well as a comparison with similar homes in the area
Home Values in the Area
Average Home Value in this Area
Purchase History
| Date | Buyer | Sale Price | Title Company |
|---|---|---|---|
| Gem Family Trust | -- | None Listed On Document | |
| Rodriguez Ceballos Maria | -- | None Available | |
| Rodriguez Maria | -- | None Available | |
| Diaz Eulalio Ceballos | -- | None Available | |
| Ceballos Maria | -- | -- | |
| Diaz Eulalio Ceballos | $108,000 | Stewart Title |
Source: Public Records
Mortgage History
| Date | Status | Borrower | Loan Amount |
|---|---|---|---|
| Previous Owner | Diaz Eulalio Ceballos | $106,784 |
Source: Public Records
Tax History Compared to Growth
Tax History
| Year | Tax Paid | Tax Assessment Tax Assessment Total Assessment is a certain percentage of the fair market value that is determined by local assessors to be the total taxable value of land and additions on the property. | Land | Improvement |
|---|---|---|---|---|
| 2025 | $748 | $50,948 | $31,325 | $19,623 |
| 2024 | $727 | $49,410 | $30,100 | $19,310 |
| 2023 | $0 | $47,750 | $29,890 | $17,860 |
| 2022 | $705 | $39,644 | $25,095 | $14,549 |
| 2021 | $685 | $30,852 | $16,765 | $14,087 |
| 2020 | $663 | $30,281 | $16,345 | $13,936 |
| 2019 | $645 | $29,082 | $15,890 | $13,192 |
| 2018 | $618 | $23,656 | $11,235 | $12,421 |
| 2017 | $599 | $22,483 | $10,150 | $12,333 |
| 2016 | $584 | $20,534 | $8,225 | $12,309 |
| 2015 | $584 | $19,255 | $7,140 | $12,115 |
| 2014 | $566 | $17,862 | $6,440 | $11,422 |
| 2013 | -- | $15,045 | $3,955 | $11,090 |
Source: Public Records
Map
Nearby Homes
- 1124 Sbragia Way
- 2154 Oppio St
- 1655 Byrd Dr
- 1365 Prospect Ave
- 1121 Greenbrae Dr
- 1595 York Way
- 1110 Xman Way
- 1003 Sbragia Way
- 1780 Greenbrae Dr
- 1160 York Way
- 1799 Vance Way
- 1345 Plymouth Way
- 1705 9th St
- 1125 Dodson Way
- 1560 Steven Ct Unit 2
- 1855 Verano Dr
- 1527 Steven Ct
- 1536 Irene Way
- 973 Damon Ln
- 1841 Merchant St
- 1365 Tyler Way
- 1325 Tyler Way
- 1340 Sbragia Way
- 1385 Tyler Way
- 1305 Tyler Way
- 1360 Sbragia Way
- 1320 Sbragia Way
- 1400 Sbragia Way
- 1340 Tyler Way
- 1320 Tyler Way
- 1360 Tyler Way
- 1300 Sbragia Way
- 1425 Tyler Way
- 1285 Tyler Way
- 1300 Tyler Way
- 1380 Tyler Way
- 1420 Sbragia Way
- 1280 Sbragia Way
- 1280 Tyler Way
- 1445 Tyler Way