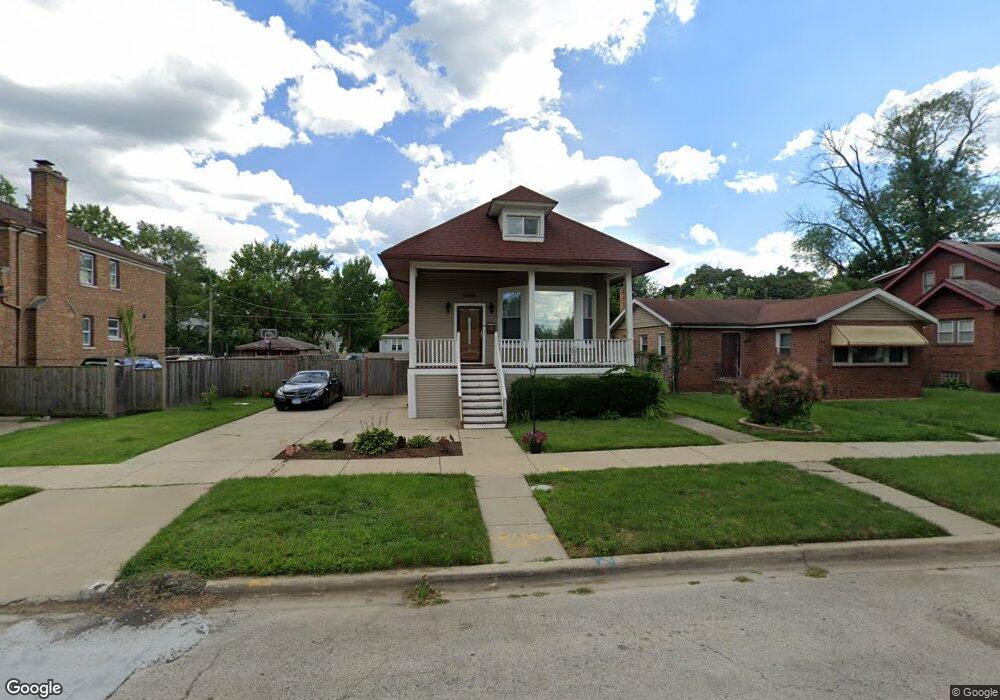
1345 W 111th Place Chicago, IL 60643
Morgan Park NeighborhoodEstimated Value: $120,000 - $198,000
2
Beds
1
Bath
1,035
Sq Ft
$152/Sq Ft
Est. Value
About This Home
This home is located at 1345 W 111th Place, Chicago, IL 60643 and is currently estimated at $157,236, approximately $151 per square foot. 1345 W 111th Place is a home located in Cook County with nearby schools including John D. Shoop Elementary School, Morgan Park High School, and Morgan Park Academy.
Ownership History
Date
Name
Owned For
Owner Type
Purchase Details
Closed on
May 18, 2004
Sold by
Hud
Bought by
Mitchell Rodney L
Current Estimated Value
Home Financials for this Owner
Home Financials are based on the most recent Mortgage that was taken out on this home.
Original Mortgage
$71,900
Outstanding Balance
$44,021
Interest Rate
10.12%
Mortgage Type
Unknown
Estimated Equity
$113,215
Purchase Details
Closed on
Jun 11, 2003
Sold by
Keith Arnita
Bought by
Hud
Purchase Details
Closed on
Sep 27, 2000
Sold by
Suburban Bank & Trust Company
Bought by
Keith Arnita
Home Financials for this Owner
Home Financials are based on the most recent Mortgage that was taken out on this home.
Original Mortgage
$84,300
Interest Rate
7.96%
Mortgage Type
FHA
Purchase Details
Closed on
Mar 2, 2000
Sold by
Alaska Seaboard Partners
Bought by
Suburban Bank & Trust Company and Trust #1-1790
Purchase Details
Closed on
Sep 30, 1999
Sold by
Bcgs Llc
Bought by
Alaska Seaboard Partners Ltd Partnership
Create a Home Valuation Report for This Property
The Home Valuation Report is an in-depth analysis detailing your home's value as well as a comparison with similar homes in the area
Home Values in the Area
Average Home Value in this Area
Purchase History
| Date | Buyer | Sale Price | Title Company |
|---|---|---|---|
| Mitchell Rodney L | -- | Stewart Title Of Illinois | |
| Hud | -- | -- | |
| Keith Arnita | $85,000 | -- | |
| Suburban Bank & Trust Company | $28,000 | -- | |
| Alaska Seaboard Partners Ltd Partnership | -- | -- |
Source: Public Records
Mortgage History
| Date | Status | Borrower | Loan Amount |
|---|---|---|---|
| Open | Mitchell Rodney L | $71,900 | |
| Previous Owner | Keith Arnita | $84,300 | |
| Closed | Mitchell Rodney L | $18,000 |
Source: Public Records
Tax History Compared to Growth
Tax History
| Year | Tax Paid | Tax Assessment Tax Assessment Total Assessment is a certain percentage of the fair market value that is determined by local assessors to be the total taxable value of land and additions on the property. | Land | Improvement |
|---|---|---|---|---|
| 2024 | $356 | $10,000 | $5,625 | $4,375 |
| 2023 | $326 | $5,000 | $2,680 | $2,320 |
| 2022 | $326 | $5,000 | $2,680 | $2,320 |
| 2021 | $337 | $5,000 | $2,681 | $2,319 |
| 2020 | $1,199 | $8,470 | $6,093 | $2,377 |
| 2019 | $1,184 | $9,308 | $6,093 | $3,215 |
| 2018 | $1,163 | $9,308 | $6,093 | $3,215 |
| 2017 | $1,547 | $10,545 | $5,625 | $4,920 |
| 2016 | $1,616 | $10,545 | $5,625 | $4,920 |
| 2015 | $1,455 | $10,545 | $5,625 | $4,920 |
| 2014 | $1,477 | $10,510 | $5,156 | $5,354 |
| 2013 | $1,437 | $10,510 | $5,156 | $5,354 |
Source: Public Records
Map
Nearby Homes
- 1313 W 112th St
- 1309 W 110th Place
- 1237 W 110th Place
- 1416 W 110th Place
- 1203 W 110th St
- 11345 S Ada St
- 1105 W 111th Place
- 1208 W 109th Place
- 1115 W 110th St
- 11425 S Elizabeth St
- 1342 W 108th Place
- 11367 S Aberdeen St
- 1431 W 108th St Unit C
- 11328 S Morgan St
- 11015 S Morgan St
- 11531 S Throop St
- 11530 S Racine Ave
- 1721 W Steuben St
- 11518 S Aberdeen St
- 11604 S Elizabeth St
- 1353 W 111th Place
- 1339 W 111th Place
- 1339 W 111th Place
- 1357 W 111th Place
- 1335 W 111th Place
- 1344 W 112th St
- 1342 W 112th St
- 1336 W 112th St
- 1356 W 112th St
- 1334 W 112th St
- 1342 W 111th Place
- 1346 W 111th Place
- 1346 W 111th Place
- 1338 W 111th Place
- 1327 W 111th Place
- 1348 W 111th St
- 1348 W 111th St
- 1334 W 111th Place
- 1332 W 111th Place
- 1328 W 111th Place