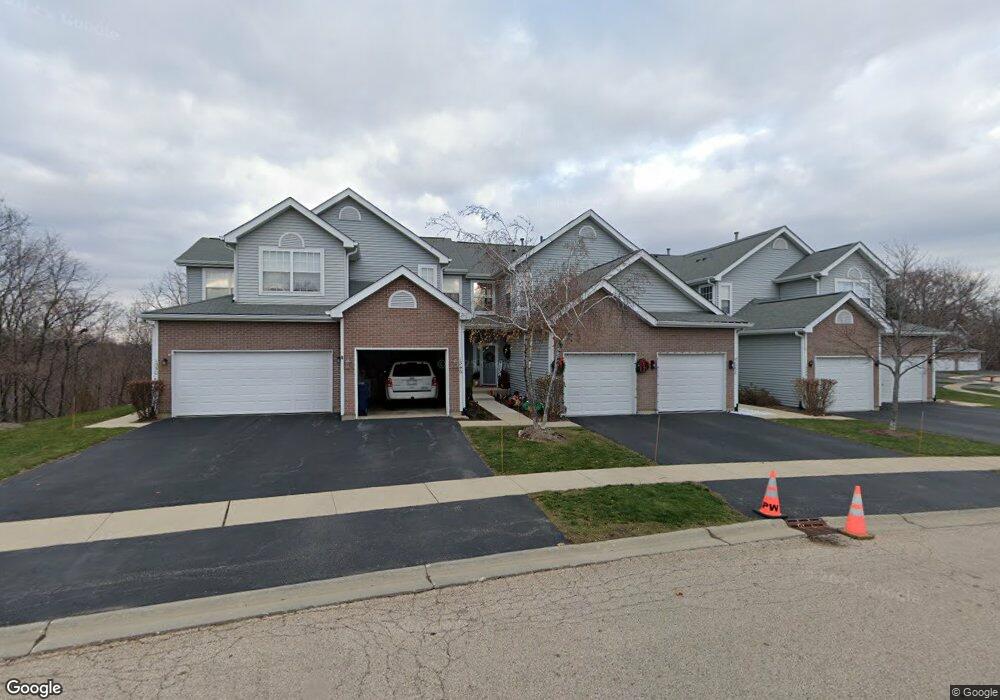
1346 Grandview Ct Algonquin, IL 60102
Estimated Value: $257,000 - $294,000
2
Beds
2
Baths
1,272
Sq Ft
$211/Sq Ft
Est. Value
About This Home
This home is located at 1346 Grandview Ct, Algonquin, IL 60102 and is currently estimated at $268,009, approximately $210 per square foot. 1346 Grandview Ct is a home located in McHenry County with nearby schools including Westfield Community School, Kenneth E Neubert Elementary School, and United Junior High School.
Ownership History
Date
Name
Owned For
Owner Type
Purchase Details
Closed on
Apr 12, 2002
Sold by
Bearer Kathleen E and Perik Kathleen E
Bought by
Perik Troy R
Current Estimated Value
Home Financials for this Owner
Home Financials are based on the most recent Mortgage that was taken out on this home.
Original Mortgage
$128,800
Outstanding Balance
$65,189
Interest Rate
9.99%
Estimated Equity
$202,820
Purchase Details
Closed on
Sep 3, 1998
Sold by
Dustin Eric
Bought by
Perik Troy R and Bearer Kathleen E
Home Financials for this Owner
Home Financials are based on the most recent Mortgage that was taken out on this home.
Original Mortgage
$116,871
Interest Rate
7.04%
Mortgage Type
FHA
Purchase Details
Closed on
Jul 15, 1995
Sold by
Maywood Proviso State Bank
Bought by
Dustin Eric
Home Financials for this Owner
Home Financials are based on the most recent Mortgage that was taken out on this home.
Original Mortgage
$114,929
Interest Rate
7.59%
Mortgage Type
FHA
Create a Home Valuation Report for This Property
The Home Valuation Report is an in-depth analysis detailing your home's value as well as a comparison with similar homes in the area
Home Values in the Area
Average Home Value in this Area
Purchase History
| Date | Buyer | Sale Price | Title Company |
|---|---|---|---|
| Perik Troy R | -- | Integrity Title | |
| Perik Troy R | $118,000 | -- | |
| Dustin Eric | $117,500 | -- |
Source: Public Records
Mortgage History
| Date | Status | Borrower | Loan Amount |
|---|---|---|---|
| Open | Perik Troy R | $128,800 | |
| Closed | Perik Troy R | $116,871 | |
| Previous Owner | Dustin Eric | $114,929 | |
| Closed | Perik Troy R | $16,100 |
Source: Public Records
Tax History Compared to Growth
Tax History
| Year | Tax Paid | Tax Assessment Tax Assessment Total Assessment is a certain percentage of the fair market value that is determined by local assessors to be the total taxable value of land and additions on the property. | Land | Improvement |
|---|---|---|---|---|
| 2024 | $4,724 | $68,387 | $13,825 | $54,562 |
| 2023 | $4,450 | $61,164 | $12,365 | $48,799 |
| 2022 | $4,237 | $55,402 | $11,160 | $44,242 |
| 2021 | $4,047 | $51,614 | $10,397 | $41,217 |
| 2020 | $3,932 | $49,787 | $10,029 | $39,758 |
| 2019 | $3,825 | $47,652 | $9,599 | $38,053 |
| 2018 | $3,559 | $43,336 | $8,867 | $34,469 |
| 2017 | $3,468 | $40,825 | $8,353 | $32,472 |
| 2016 | $3,396 | $38,290 | $7,834 | $30,456 |
| 2013 | -- | $44,266 | $7,308 | $36,958 |
Source: Public Records
Map
Nearby Homes
- 16 Brian Ct
- 266 Grandview Ct
- 909 Roger St
- LOT 3 Blackhawk Dr
- 135 Arquilla Dr
- 807 Menominee Dr
- Lots 10 & 11 Ramble Rd
- 809 Menominee Dr
- 1235 Fairmont Ct
- 900 Windstone Ct
- 937 Mesa Dr
- 721 Brentwood Ct
- 305 Buckingham Dr
- 700 Fairfield Ln
- 70 Hilltop Dr Unit 4
- 113 Pheasant Trail
- 1019 Maple St
- 992 Mcphee Dr
- 101 Oakleaf Rd
- 661 Majestic Dr
- 1342 Grandview Ct
- 1338 Grandview Ct Unit 3
- 1334 Grandview Ct
- 1334 Grandview Ct Unit 1334
- 1350 Grandview Ct
- 1330 Grandview Ct
- 1354 Grandview Ct
- 1354 Grandview Ct Unit 1354
- 1358 Grandview Ct Unit 205
- 1362 Grandview Ct
- 2 Brian Ct
- 2 Brian Ct
- 1363 Grandview Ct
- 1366 Grandview Ct
- 4 Brian Ct
- 1367 Grandview Ct
- 201 Grandview Ct Unit 2
- 6 Brian Ct Unit 2
- 203 Grandview Ct
- 8 Brian Ct