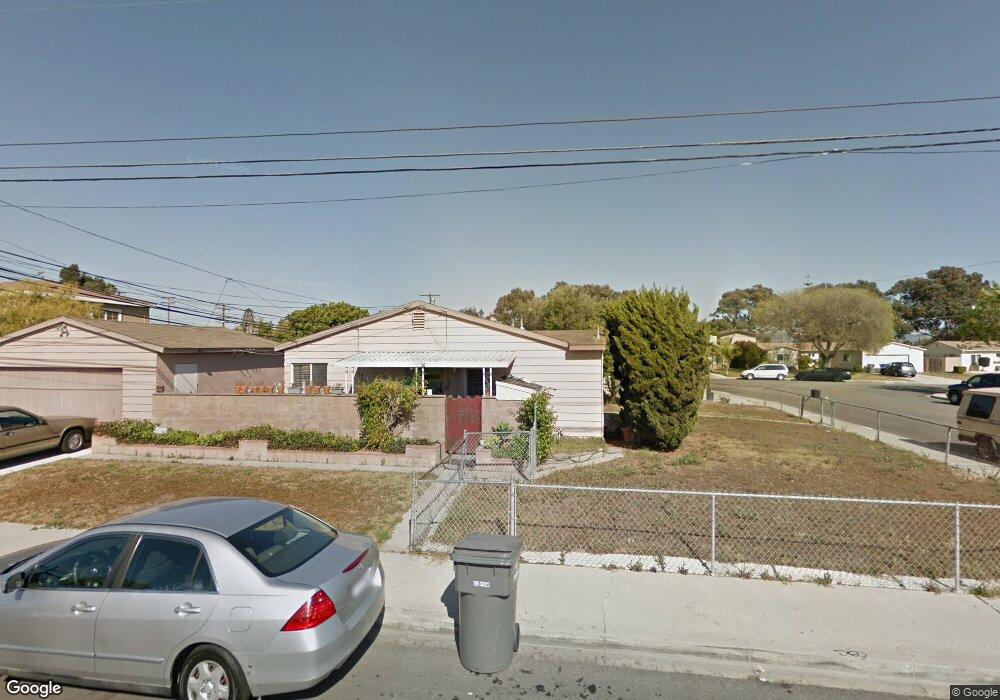
1346 N 7th Place Port Hueneme, CA 93041
Estimated Value: $672,353 - $710,000
4
Beds
2
Baths
1,227
Sq Ft
$563/Sq Ft
Est. Value
About This Home
This home is located at 1346 N 7th Place, Port Hueneme, CA 93041 and is currently estimated at $691,338, approximately $563 per square foot. 1346 N 7th Place is a home located in Ventura County with nearby schools including Parkview Elementary and Hueneme High School.
Ownership History
Date
Name
Owned For
Owner Type
Purchase Details
Closed on
Jul 2, 2008
Sold by
Angulo Estella
Bought by
Bank Of New York
Current Estimated Value
Create a Home Valuation Report for This Property
The Home Valuation Report is an in-depth analysis detailing your home's value as well as a comparison with similar homes in the area
Home Values in the Area
Average Home Value in this Area
Purchase History
| Date | Buyer | Sale Price | Title Company |
|---|---|---|---|
| Bank Of New York | $257,082 | Landsafe |
Source: Public Records
Tax History Compared to Growth
Tax History
| Year | Tax Paid | Tax Assessment Tax Assessment Total Assessment is a certain percentage of the fair market value that is determined by local assessors to be the total taxable value of land and additions on the property. | Land | Improvement |
|---|---|---|---|---|
| 2025 | $1,474 | $115,428 | $21,472 | $93,956 |
| 2024 | $1,474 | $113,165 | $21,051 | $92,114 |
| 2023 | $1,406 | $110,947 | $20,639 | $90,308 |
| 2022 | $1,370 | $108,772 | $20,234 | $88,538 |
| 2021 | $1,369 | $106,640 | $19,838 | $86,802 |
| 2020 | $1,354 | $105,549 | $19,636 | $85,913 |
| 2019 | $1,337 | $103,480 | $19,251 | $84,229 |
| 2018 | $1,296 | $101,452 | $18,874 | $82,578 |
| 2017 | $1,252 | $99,463 | $18,504 | $80,959 |
| 2016 | $1,218 | $97,514 | $18,142 | $79,372 |
| 2015 | $1,191 | $96,051 | $17,870 | $78,181 |
| 2014 | $1,179 | $94,171 | $17,521 | $76,650 |
Source: Public Records
Map
Nearby Homes
- 1544 N 8th St
- 1623 N 5th St
- 4811 S G St
- 866 Yucca St
- 1745 N 7th Place
- 775 Thayer Ln
- 655 Dahl Ave
- 713 E Clara St
- 5233 Perkins Rd
- 225 Glacier Ave
- 470 Sanddollar Ln
- 632 Joyce Dr
- 331 Campbell Way
- 4578 Saviers Rd
- 350 Campbell Way
- 3050 Jackson St
- 140 Borrego Ave Unit 174
- 5420 S J St
- 180 Gaviota Place Unit 155
- 234 Johnson Rd