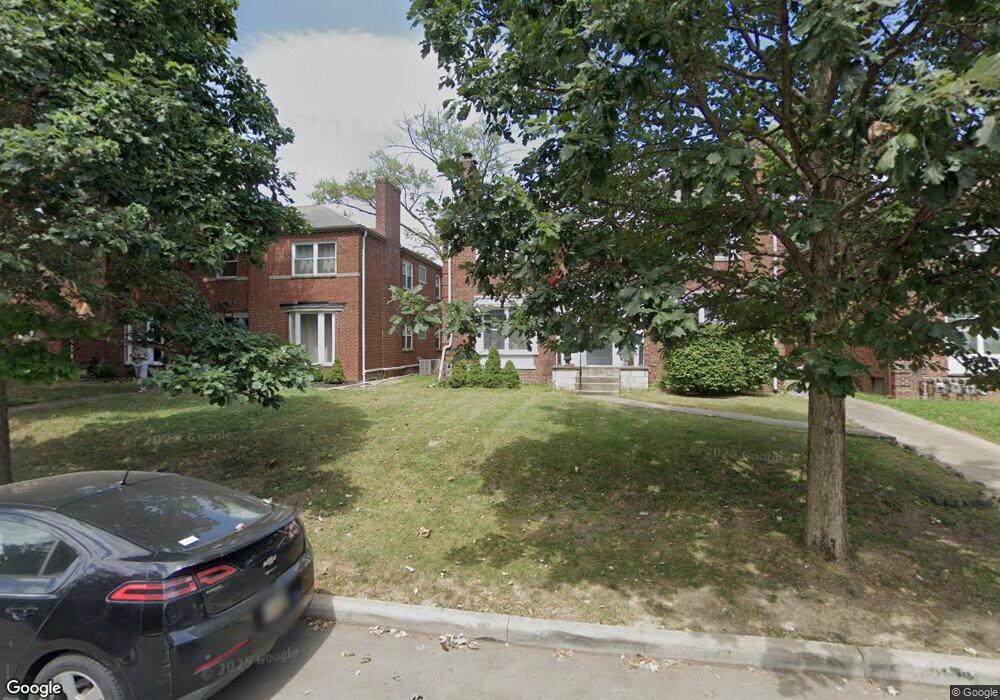
1346 W 6th Ave Unit TWENTY Columbus, OH 43212
Fifth by Northwest NeighborhoodEstimated Value: $133,000 - $165,000
3
Beds
2
Baths
884
Sq Ft
$172/Sq Ft
Est. Value
About This Home
This home is located at 1346 W 6th Ave Unit TWENTY, Columbus, OH 43212 and is currently estimated at $152,230, approximately $172 per square foot. 1346 W 6th Ave Unit TWENTY is a home located in Franklin County with nearby schools including Cranbrook Elementary School, Ridgeview Middle School, and Centennial High School.
Ownership History
Date
Name
Owned For
Owner Type
Purchase Details
Closed on
Aug 9, 2024
Sold by
Ck Real Estate Holdings Llc
Bought by
Jackson Leanna
Current Estimated Value
Home Financials for this Owner
Home Financials are based on the most recent Mortgage that was taken out on this home.
Original Mortgage
$106,000
Interest Rate
6.86%
Mortgage Type
New Conventional
Purchase Details
Closed on
Apr 20, 2022
Sold by
White Charles J
Bought by
Ck Real Estate Holdings Llc
Purchase Details
Closed on
May 12, 2000
Sold by
Trinh Fung Sujen
Bought by
Newsome Samuel E
Home Financials for this Owner
Home Financials are based on the most recent Mortgage that was taken out on this home.
Original Mortgage
$58,750
Interest Rate
8.21%
Mortgage Type
Balloon
Purchase Details
Closed on
May 28, 1998
Sold by
To Phung and Tang Hao
Bought by
Trinh Fung Sujen
Purchase Details
Closed on
Jan 16, 1992
Purchase Details
Closed on
Nov 25, 1991
Create a Home Valuation Report for This Property
The Home Valuation Report is an in-depth analysis detailing your home's value as well as a comparison with similar homes in the area
Home Values in the Area
Average Home Value in this Area
Purchase History
| Date | Buyer | Sale Price | Title Company |
|---|---|---|---|
| Jackson Leanna | -- | Elite Land Title | |
| Ck Real Estate Holdings Llc | $79,250 | Allodial Title | |
| Newsome Samuel E | $59,000 | Chelsea Title Agency | |
| Trinh Fung Sujen | -- | -- | |
| -- | -- | -- | |
| -- | -- | -- |
Source: Public Records
Mortgage History
| Date | Status | Borrower | Loan Amount |
|---|---|---|---|
| Previous Owner | Jackson Leanna | $106,000 | |
| Previous Owner | Newsome Samuel E | $58,750 |
Source: Public Records
Tax History Compared to Growth
Tax History
| Year | Tax Paid | Tax Assessment Tax Assessment Total Assessment is a certain percentage of the fair market value that is determined by local assessors to be the total taxable value of land and additions on the property. | Land | Improvement |
|---|---|---|---|---|
| 2024 | $2,090 | $45,610 | $5,320 | $40,290 |
| 2023 | $2,242 | $45,610 | $5,320 | $40,290 |
| 2022 | $1,000 | $19,290 | $2,730 | $16,560 |
| 2021 | $1,002 | $19,290 | $2,730 | $16,560 |
| 2020 | $1,004 | $19,290 | $2,730 | $16,560 |
| 2019 | $975 | $16,070 | $2,280 | $13,790 |
| 2018 | $916 | $16,070 | $2,280 | $13,790 |
| 2017 | $960 | $16,070 | $2,280 | $13,790 |
| 2016 | $946 | $14,280 | $3,080 | $11,200 |
| 2015 | $859 | $14,280 | $3,080 | $11,200 |
| 2014 | $861 | $14,280 | $3,080 | $11,200 |
| 2013 | $472 | $15,890 | $3,430 | $12,460 |
Source: Public Records
Map
Nearby Homes
- 1364 W 7th Ave
- 00 W 7th Ave
- 1475 W 3rd Ave Unit 204
- 1126 King Ave Unit 128
- 1661 Ashland Ave Unit 663
- 1398 Lower Green Cir Unit 1398
- 1297 Doten Ave
- 1733 Elmwood Ave
- 1459 Elmwood Ave Unit 1459
- 1225 Eastview Ave
- 1095 W 3rd Ave
- 1093 W 3rd Ave
- 1561 Glenn Ave
- 1242 Oxley Rd
- 1240 Oxley Rd
- 1083 W 3rd Ave
- 1782 Wyandotte Rd
- 1111 Northwest Blvd Unit 113
- 1081 W 3rd Ave
- 1359 Bluff Ave Unit A
- 1344 W 6th Ave
- 1350 W 6th Ave
- 1338 W 6th Ave Unit 340
- 1356 W 6th Ave
- 1343 W 6th Ave Unit 345
- 1330 W 6th Ave
- 1360 W 6th Ave Unit TWENTY
- 1332 W 6th Ave Unit 334
- 1345 W 6th Ave Unit . B
- 1345 W 6th Ave Unit . A
- 1345 W 6th Ave
- 1335 W 6th Ave Unit 337
- 1339 W 6th Ave
- 1353 W 6th Ave
- 1331 W 7th Ave
- 1368 W 6th Ave
- 1343 W 7th Ave
- 1318 W 6th Ave Unit 320
- 1323 W 7th Ave
- 1370 W 6th Ave Unit 372