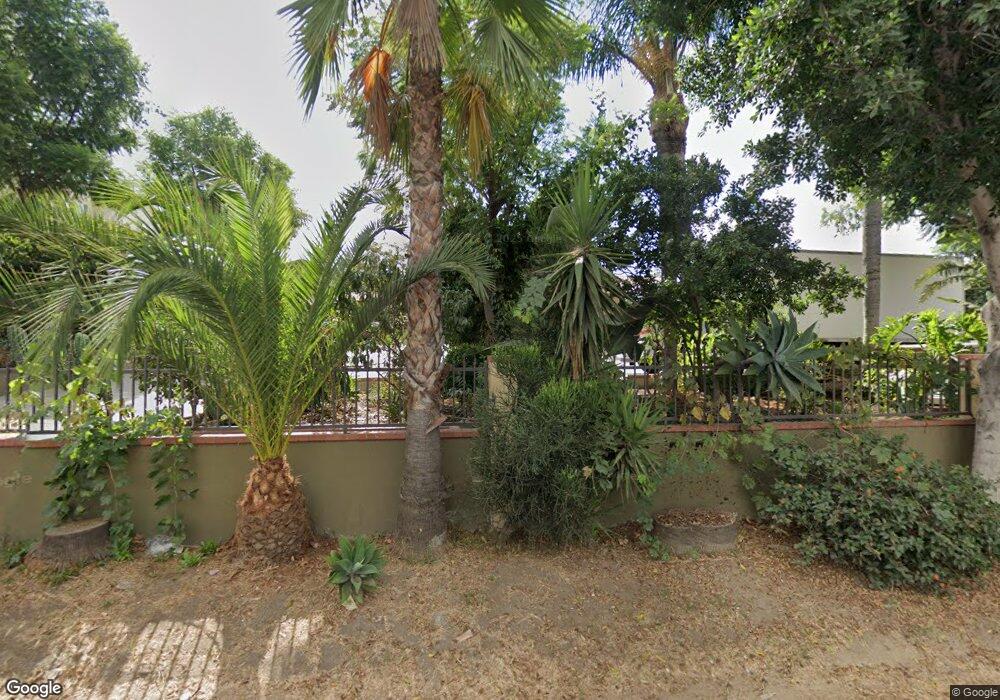
13466 Hubbard St Sylmar, CA 91342
Estimated Value: $1,005,430 - $1,063,000
3
Beds
3
Baths
2,442
Sq Ft
$423/Sq Ft
Est. Value
About This Home
This home is located at 13466 Hubbard St, Sylmar, CA 91342 and is currently estimated at $1,031,858, approximately $422 per square foot. 13466 Hubbard St is a home located in Los Angeles County with nearby schools including Olive Vista Middle School, San Fernando Senior High School, and Fenton Primary Center.
Ownership History
Date
Name
Owned For
Owner Type
Purchase Details
Closed on
Aug 1, 2024
Sold by
Mansilla Adrian and Mansilla Gladys L
Bought by
Adrian And Gladys Mansilla Family Trust and Mansilla
Current Estimated Value
Purchase Details
Closed on
Dec 1, 2005
Sold by
Mansilla Adrian and Mansilla Gladys L
Bought by
Mansilla Adrian
Home Financials for this Owner
Home Financials are based on the most recent Mortgage that was taken out on this home.
Original Mortgage
$500,000
Interest Rate
6.12%
Mortgage Type
Purchase Money Mortgage
Purchase Details
Closed on
Nov 18, 2002
Sold by
Mansilla Adrian
Bought by
Mansilla Adrian
Purchase Details
Closed on
Feb 7, 1996
Sold by
Olson Martha Lee
Bought by
Olson James P
Purchase Details
Closed on
Dec 21, 1995
Sold by
Olson James P and Heaney Diana Gail
Bought by
Olson Martha Lee and Baker Marti
Create a Home Valuation Report for This Property
The Home Valuation Report is an in-depth analysis detailing your home's value as well as a comparison with similar homes in the area
Home Values in the Area
Average Home Value in this Area
Purchase History
| Date | Buyer | Sale Price | Title Company |
|---|---|---|---|
| Adrian And Gladys Mansilla Family Trust | -- | None Listed On Document | |
| Adrian And Gladys Mansilla Family Trust | -- | None Listed On Document | |
| Mansilla Adrian | -- | Alliance Title Company | |
| Mansilla Adrian | -- | -- | |
| Olson James P | -- | -- | |
| Olson Martha Lee | -- | -- |
Source: Public Records
Mortgage History
| Date | Status | Borrower | Loan Amount |
|---|---|---|---|
| Previous Owner | Mansilla Adrian | $500,000 |
Source: Public Records
Tax History Compared to Growth
Tax History
| Year | Tax Paid | Tax Assessment Tax Assessment Total Assessment is a certain percentage of the fair market value that is determined by local assessors to be the total taxable value of land and additions on the property. | Land | Improvement |
|---|---|---|---|---|
| 2025 | $5,083 | $390,508 | $244,482 | $146,026 |
| 2024 | $5,083 | $382,852 | $239,689 | $143,163 |
| 2023 | $4,991 | $375,346 | $234,990 | $140,356 |
| 2022 | $4,774 | $367,987 | $230,383 | $137,604 |
| 2021 | $4,706 | $360,772 | $225,866 | $134,906 |
| 2019 | $4,573 | $350,073 | $219,168 | $130,905 |
| 2018 | $4,322 | $343,210 | $214,871 | $128,339 |
| 2016 | $4,109 | $329,884 | $206,528 | $123,356 |
| 2015 | $4,050 | $324,930 | $203,426 | $121,504 |
| 2014 | $4,074 | $318,566 | $199,442 | $119,124 |
Source: Public Records
Map
Nearby Homes
- 13475 Hubbard St Unit 31
- 13148 Gladstone Ave
- 13372 Hyland Ct
- 13540 Hubbard St Unit 21
- 13427 Beaver St
- 13197 Leach St
- 13441 Fenton Ave
- 13414 Herron St
- 13247 Tripoli Ave
- 12888 Four Palms Ln
- 13912 N Mesa Alta Rd
- 13550 Foothill Blvd Unit 27
- 13507 Raven St
- 13567 Eldridge Ave
- 13750 Hubbard St Unit 77
- 12826 Bromont Ave
- 13631 Eldridge Ave
- 13307 Herron St
- 13144 Bromont Ave Unit 42
- 13384 Foothill Blvd
- 13458 Hubbard St
- 13450 Hubbard St
- 13474 Hubbard St
- 13148 Gladstone Ave
- 13223 N Lost Trail Dr
- 13215 N Lost Trail Dr
- 13207 N Lost Trail Dr
- 13435 Hubbard St
- 13411 Mourning Dove Ln
- 13482 Hubbard St Unit 20
- 13463 Hubbard St
- 13487 Hubbard St Unit 10
- 13487 Hubbard St Unit 9
- 13461 Hubbard St Unit 48
- 13461 Hubbard St Unit 47
- 13461 Hubbard St Unit 46
- 13461 Hubbard St Unit 45
- 13463 Hubbard St Unit 44
- 13463 Hubbard St Unit 43
- 13475 Hubbard St Unit 26