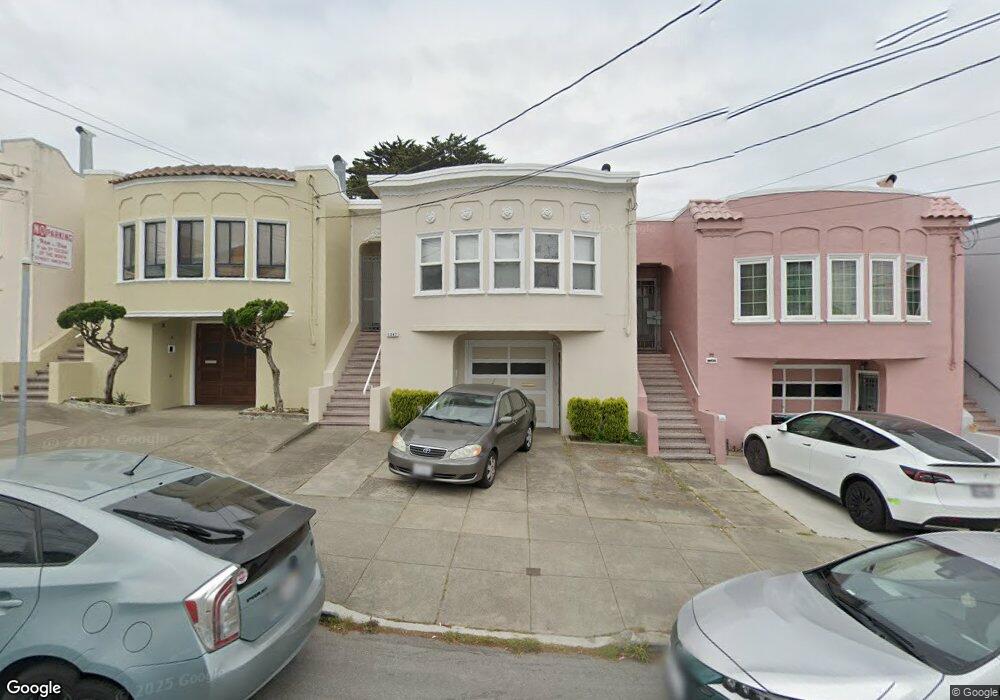
1347 34th Ave San Francisco, CA 94122
Central Sunset NeighborhoodEstimated Value: $1,489,000 - $2,084,000
4
Beds
3
Baths
1,610
Sq Ft
$1,092/Sq Ft
Est. Value
About This Home
This home is located at 1347 34th Ave, San Francisco, CA 94122 and is currently estimated at $1,758,276, approximately $1,092 per square foot. 1347 34th Ave is a home located in San Francisco County with nearby schools including Stevenson (Robert Louis) Elementary School, Giannini (A.P.) Middle School, and Holy Name Elementary School.
Ownership History
Date
Name
Owned For
Owner Type
Purchase Details
Closed on
Feb 11, 2004
Sold by
Mcspadden Shireen
Bought by
Ta Huong Le
Current Estimated Value
Home Financials for this Owner
Home Financials are based on the most recent Mortgage that was taken out on this home.
Original Mortgage
$489,200
Outstanding Balance
$212,110
Interest Rate
4.75%
Mortgage Type
New Conventional
Estimated Equity
$1,546,166
Create a Home Valuation Report for This Property
The Home Valuation Report is an in-depth analysis detailing your home's value as well as a comparison with similar homes in the area
Home Values in the Area
Average Home Value in this Area
Purchase History
| Date | Buyer | Sale Price | Title Company |
|---|---|---|---|
| Ta Huong Le | $612,000 | Chicago Title Company |
Source: Public Records
Mortgage History
| Date | Status | Borrower | Loan Amount |
|---|---|---|---|
| Open | Ta Huong Le | $489,200 |
Source: Public Records
Tax History Compared to Growth
Tax History
| Year | Tax Paid | Tax Assessment Tax Assessment Total Assessment is a certain percentage of the fair market value that is determined by local assessors to be the total taxable value of land and additions on the property. | Land | Improvement |
|---|---|---|---|---|
| 2025 | $14,196 | $1,233,598 | $740,160 | $493,438 |
| 2024 | $14,196 | $1,209,411 | $725,648 | $483,763 |
| 2023 | $13,992 | $1,185,698 | $711,420 | $474,278 |
| 2022 | $14,364 | $1,162,450 | $697,471 | $464,979 |
| 2021 | $14,107 | $1,139,658 | $683,796 | $455,862 |
| 2020 | $14,175 | $1,127,973 | $676,785 | $451,188 |
| 2019 | $13,688 | $1,105,857 | $663,515 | $442,342 |
| 2018 | $13,226 | $1,084,174 | $650,505 | $433,669 |
| 2017 | $12,770 | $1,062,916 | $637,750 | $425,166 |
| 2016 | $12,558 | $1,042,076 | $625,246 | $416,830 |
| 2015 | $12,401 | $1,026,424 | $615,855 | $410,569 |
| 2014 | $12,073 | $1,006,319 | $603,792 | $402,527 |
Source: Public Records
Map
Nearby Homes