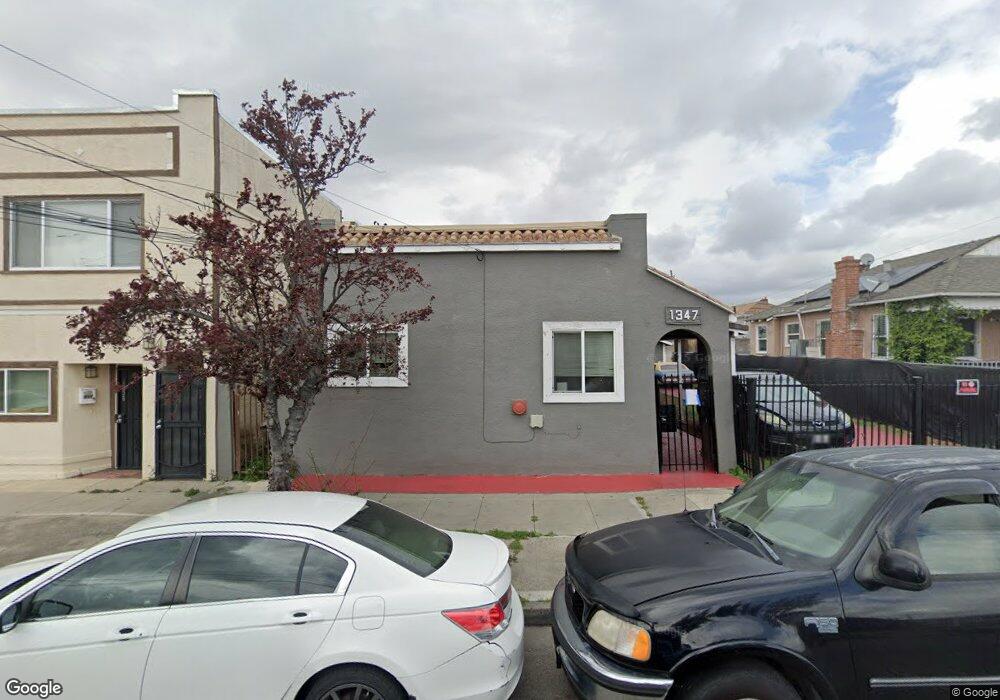
1347 89th Ave Oakland, CA 94621
Highland NeighborhoodEstimated Value: $586,000 - $732,000
--
Bed
4
Baths
1,995
Sq Ft
$336/Sq Ft
Est. Value
About This Home
This home is located at 1347 89th Ave, Oakland, CA 94621 and is currently estimated at $671,266, approximately $336 per square foot. 1347 89th Ave is a home located in Alameda County with nearby schools including New Highland Academy, Acorn Woodland Elementary School, and Encompass Academy Elementary.
Ownership History
Date
Name
Owned For
Owner Type
Purchase Details
Closed on
May 22, 2014
Sold by
Hedjazi Susan
Bought by
Calderon Abraham
Current Estimated Value
Home Financials for this Owner
Home Financials are based on the most recent Mortgage that was taken out on this home.
Original Mortgage
$283,850
Outstanding Balance
$215,840
Interest Rate
4.27%
Mortgage Type
New Conventional
Estimated Equity
$455,426
Purchase Details
Closed on
Aug 7, 2012
Sold by
The Bank Of New York Mellon
Bought by
New Horizons Property Management & Servi
Purchase Details
Closed on
Dec 9, 2011
Sold by
Franklin Debra V
Bought by
The Bank Of New York Mellon and The Bank Of New York
Purchase Details
Closed on
Dec 11, 2006
Sold by
Franklin Keith
Bought by
Franklin Debra V
Home Financials for this Owner
Home Financials are based on the most recent Mortgage that was taken out on this home.
Original Mortgage
$487,500
Interest Rate
8.5%
Mortgage Type
Negative Amortization
Purchase Details
Closed on
Sep 1, 2006
Sold by
Ofoegbu Collins A and Ofoegbu Nnenna
Bought by
Franklin Debra V
Home Financials for this Owner
Home Financials are based on the most recent Mortgage that was taken out on this home.
Original Mortgage
$470,000
Interest Rate
6.87%
Mortgage Type
Purchase Money Mortgage
Purchase Details
Closed on
Aug 30, 2006
Sold by
Franklin Keith
Bought by
Franklin Debra V
Home Financials for this Owner
Home Financials are based on the most recent Mortgage that was taken out on this home.
Original Mortgage
$470,000
Interest Rate
6.87%
Mortgage Type
Purchase Money Mortgage
Purchase Details
Closed on
Nov 11, 1999
Sold by
Johnson Arthur
Bought by
Ofoegbu Collins A and Ofoegbu Nenna
Home Financials for this Owner
Home Financials are based on the most recent Mortgage that was taken out on this home.
Original Mortgage
$173,000
Interest Rate
7.95%
Create a Home Valuation Report for This Property
The Home Valuation Report is an in-depth analysis detailing your home's value as well as a comparison with similar homes in the area
Home Values in the Area
Average Home Value in this Area
Purchase History
| Date | Buyer | Sale Price | Title Company |
|---|---|---|---|
| Calderon Abraham | -- | North American Title Co Inc | |
| Calderon Abraham | $378,500 | North American Title Co Inc | |
| New Horizons Property Management & Servi | $190,000 | Chicago Title Company | |
| The Bank Of New York Mellon | $157,500 | Landsafe Title | |
| Franklin Debra V | -- | North American Title Co | |
| Franklin Debra V | $650,000 | Fidelity National Title Co | |
| Franklin Debra V | -- | Fidelity National Title Co | |
| Ofoegbu Collins A | $173,000 | North American Title Co |
Source: Public Records
Mortgage History
| Date | Status | Borrower | Loan Amount |
|---|---|---|---|
| Open | Calderon Abraham | $283,850 | |
| Closed | Calderon Abraham | $283,850 | |
| Previous Owner | Franklin Debra V | $487,500 | |
| Previous Owner | Franklin Debra V | $470,000 | |
| Previous Owner | Franklin Debra V | $470,000 | |
| Previous Owner | Ofoegbu Collins A | $173,000 |
Source: Public Records
Tax History Compared to Growth
Tax History
| Year | Tax Paid | Tax Assessment Tax Assessment Total Assessment is a certain percentage of the fair market value that is determined by local assessors to be the total taxable value of land and additions on the property. | Land | Improvement |
|---|---|---|---|---|
| 2025 | $9,647 | $463,968 | $139,129 | $324,839 |
| 2024 | $9,647 | $454,873 | $136,402 | $318,471 |
| 2023 | $9,903 | $445,955 | $133,727 | $312,228 |
| 2022 | $9,374 | $437,212 | $131,106 | $306,106 |
| 2021 | $8,560 | $428,643 | $128,536 | $300,107 |
| 2020 | $8,454 | $424,248 | $127,218 | $297,030 |
| 2019 | $13,053 | $415,933 | $124,725 | $291,208 |
| 2018 | $7,705 | $407,780 | $122,280 | $285,500 |
| 2017 | $7,291 | $399,786 | $119,883 | $279,903 |
| 2016 | $7,033 | $391,947 | $117,532 | $274,415 |
| 2015 | $6,988 | $386,061 | $115,767 | $270,294 |
| 2014 | $4,545 | $190,761 | $57,158 | $133,603 |
Source: Public Records
Map
Nearby Homes