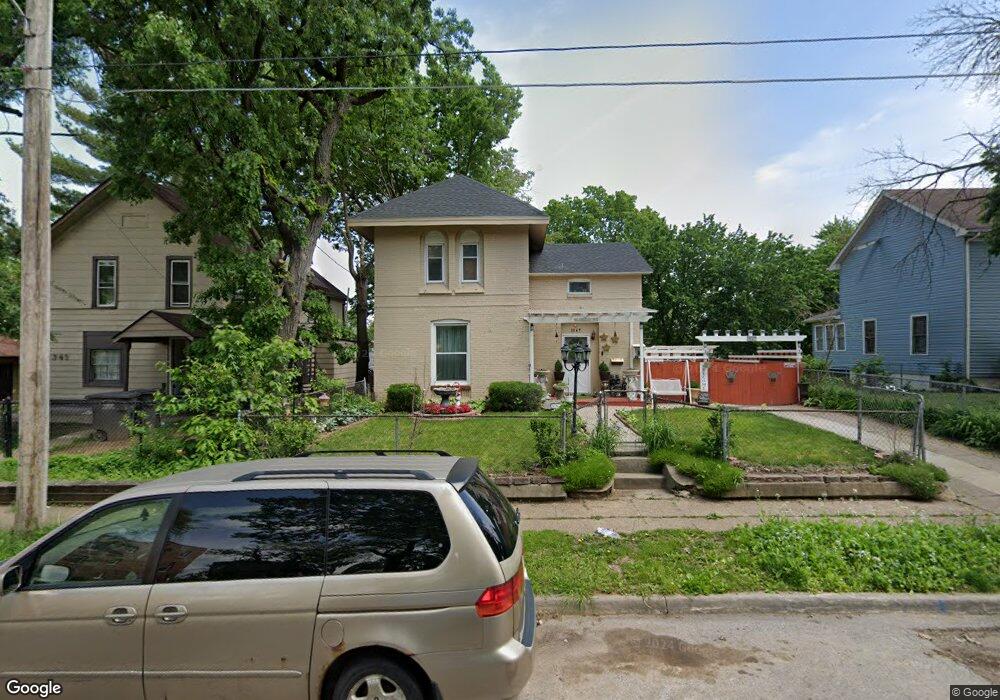
1347 8th St Des Moines, IA 50314
River Bend NeighborhoodEstimated Value: $112,000 - $203,000
3
Beds
2
Baths
1,784
Sq Ft
$93/Sq Ft
Est. Value
About This Home
This home is located at 1347 8th St, Des Moines, IA 50314 and is currently estimated at $165,389, approximately $92 per square foot. 1347 8th St is a home located in Polk County with nearby schools including Moulton Elementary School, Harding Middle School, and North High School.
Ownership History
Date
Name
Owned For
Owner Type
Purchase Details
Closed on
Jun 23, 2005
Sold by
Thai Cuong and Thai Bang Tam Tammie
Bought by
Duong Chinh Thi
Current Estimated Value
Home Financials for this Owner
Home Financials are based on the most recent Mortgage that was taken out on this home.
Original Mortgage
$72,270
Outstanding Balance
$37,972
Interest Rate
5.86%
Mortgage Type
Fannie Mae Freddie Mac
Estimated Equity
$127,417
Purchase Details
Closed on
Jan 26, 2000
Sold by
Hua Quong and Truong Sophol T
Bought by
Thai Cuong and Thai Bang Tam Tammie
Create a Home Valuation Report for This Property
The Home Valuation Report is an in-depth analysis detailing your home's value as well as a comparison with similar homes in the area
Home Values in the Area
Average Home Value in this Area
Purchase History
| Date | Buyer | Sale Price | Title Company |
|---|---|---|---|
| Duong Chinh Thi | $80,000 | -- | |
| Thai Cuong | $24,500 | -- |
Source: Public Records
Mortgage History
| Date | Status | Borrower | Loan Amount |
|---|---|---|---|
| Open | Duong Chinh Thi | $72,270 |
Source: Public Records
Tax History Compared to Growth
Tax History
| Year | Tax Paid | Tax Assessment Tax Assessment Total Assessment is a certain percentage of the fair market value that is determined by local assessors to be the total taxable value of land and additions on the property. | Land | Improvement |
|---|---|---|---|---|
| 2025 | $2,974 | $170,300 | $9,800 | $160,500 |
| 2024 | $2,974 | $151,200 | $8,700 | $142,500 |
| 2023 | $2,638 | $151,200 | $8,700 | $142,500 |
| 2022 | $2,618 | $111,900 | $6,700 | $105,200 |
| 2021 | $2,440 | $111,900 | $6,700 | $105,200 |
| 2020 | $2,536 | $97,800 | $5,900 | $91,900 |
| 2019 | $2,548 | $97,800 | $5,900 | $91,900 |
| 2018 | $2,522 | $94,800 | $5,700 | $89,100 |
| 2017 | $2,312 | $94,800 | $5,700 | $89,100 |
| 2016 | $2,254 | $85,500 | $5,100 | $80,400 |
| 2015 | $2,254 | $85,500 | $5,100 | $80,400 |
| 2014 | $2,044 | $79,800 | $4,900 | $74,900 |
Source: Public Records
Map
Nearby Homes