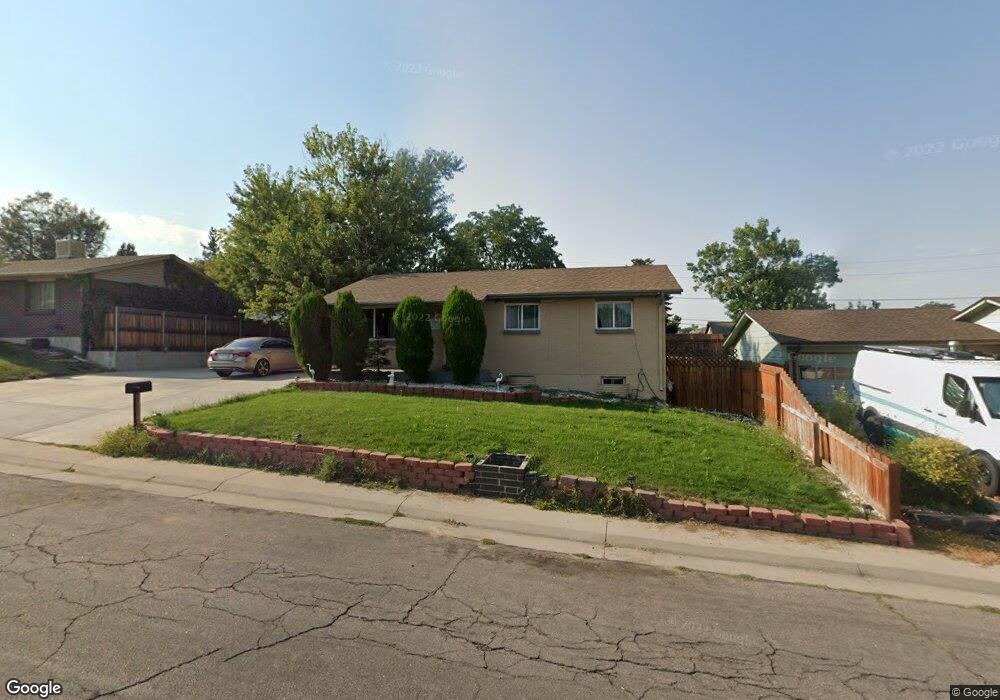
1347 Ember St Denver, CO 80221
Sherrelwood NeighborhoodEstimated Value: $395,408 - $491,000
4
Beds
2
Baths
1,060
Sq Ft
$421/Sq Ft
Est. Value
About This Home
This home is located at 1347 Ember St, Denver, CO 80221 and is currently estimated at $446,602, approximately $421 per square foot. 1347 Ember St is a home located in Adams County with nearby schools including Sherrelwood Elementary School, Iver C. Ranum Middle School, and Westminster High School.
Ownership History
Date
Name
Owned For
Owner Type
Purchase Details
Closed on
Nov 13, 2003
Sold by
Cervantes Jose and Arce Jose
Bought by
Cervantes Jose
Current Estimated Value
Home Financials for this Owner
Home Financials are based on the most recent Mortgage that was taken out on this home.
Original Mortgage
$176,980
Outstanding Balance
$82,390
Interest Rate
6.06%
Mortgage Type
FHA
Estimated Equity
$364,212
Purchase Details
Closed on
Dec 28, 2001
Sold by
Madsen Darrel A and Madsen Karen S
Bought by
Cervantes Jose and Arce Jose
Home Financials for this Owner
Home Financials are based on the most recent Mortgage that was taken out on this home.
Original Mortgage
$168,617
Interest Rate
6.73%
Mortgage Type
FHA
Purchase Details
Closed on
Oct 26, 1999
Sold by
Sbei Nancy L
Bought by
Madsen Darrel A and Madsen Karen S
Home Financials for this Owner
Home Financials are based on the most recent Mortgage that was taken out on this home.
Original Mortgage
$90,300
Interest Rate
8.99%
Mortgage Type
Purchase Money Mortgage
Create a Home Valuation Report for This Property
The Home Valuation Report is an in-depth analysis detailing your home's value as well as a comparison with similar homes in the area
Home Values in the Area
Average Home Value in this Area
Purchase History
| Date | Buyer | Sale Price | Title Company |
|---|---|---|---|
| Cervantes Jose | -- | Alta Vista Title | |
| Cervantes Jose | $171,000 | -- | |
| Madsen Darrel A | $129,000 | Land Title |
Source: Public Records
Mortgage History
| Date | Status | Borrower | Loan Amount |
|---|---|---|---|
| Open | Cervantes Jose | $176,980 | |
| Closed | Cervantes Jose | $168,617 | |
| Previous Owner | Madsen Darrel A | $90,300 | |
| Closed | Madsen Darrel A | $38,700 |
Source: Public Records
Tax History Compared to Growth
Tax History
| Year | Tax Paid | Tax Assessment Tax Assessment Total Assessment is a certain percentage of the fair market value that is determined by local assessors to be the total taxable value of land and additions on the property. | Land | Improvement |
|---|---|---|---|---|
| 2024 | $3,034 | $28,500 | $5,500 | $23,000 |
| 2023 | $3,017 | $30,570 | $5,610 | $24,960 |
| 2022 | $2,750 | $23,100 | $5,770 | $17,330 |
| 2021 | $2,811 | $23,100 | $5,770 | $17,330 |
| 2020 | $2,662 | $22,270 | $5,930 | $16,340 |
| 2019 | $2,656 | $22,270 | $5,930 | $16,340 |
| 2018 | $2,077 | $17,320 | $5,400 | $11,920 |
| 2017 | $1,815 | $17,320 | $5,400 | $11,920 |
| 2016 | $1,470 | $13,310 | $2,950 | $10,360 |
| 2015 | $1,469 | $13,310 | $2,950 | $10,360 |
| 2014 | $1,301 | $11,420 | $2,390 | $9,030 |
Source: Public Records
Map
Nearby Homes
- 1325 Elder St
- 1285 Elder St
- 1303 Lipan Dr
- 1466 Elmwood Ln
- 1390 W 78th Cir
- 7800 Greenwood Blvd
- 7733 Navajo St
- 7883 Greenwood Blvd
- 7663 Navajo St
- 7961 Granada Rd
- 921 Dakin St
- 7798 Quivas St
- 7669 Pecos St
- 1161 Dakin St
- 7973 Greenwood Blvd
- 7956 Osage St
- 1120 Dakin St
- 700 Elbert St
- 920 Delta St
- 7875 Cyd Dr