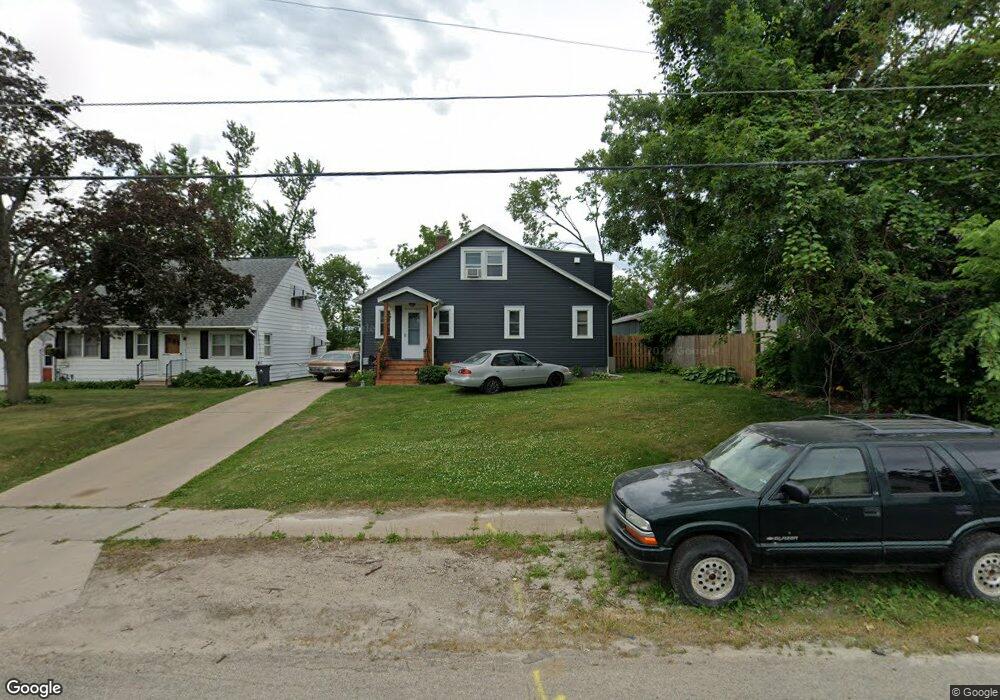
1347 G Ave NE Cedar Rapids, IA 52402
Estimated Value: $154,000 - $192,000
3
Beds
1
Bath
1,894
Sq Ft
$92/Sq Ft
Est. Value
About This Home
This home is located at 1347 G Ave NE, Cedar Rapids, IA 52402 and is currently estimated at $174,175, approximately $91 per square foot. 1347 G Ave NE is a home located in Linn County with nearby schools including Garfield Elementary School, Franklin Middle School, and George Washington High School.
Ownership History
Date
Name
Owned For
Owner Type
Purchase Details
Closed on
Apr 18, 2013
Sold by
Vandersee Kurt James
Bought by
Prouty Amy Michele
Current Estimated Value
Purchase Details
Closed on
Sep 5, 2012
Sold by
Vandersee Amy M and Prouty Amy M
Bought by
Vandersee Kurt
Purchase Details
Closed on
May 30, 2006
Sold by
Aae Llc
Bought by
Vandersee Kurt and Vandersee Amy
Home Financials for this Owner
Home Financials are based on the most recent Mortgage that was taken out on this home.
Original Mortgage
$104,000
Interest Rate
9.45%
Mortgage Type
Unknown
Purchase Details
Closed on
Jun 30, 2003
Sold by
Martin Chad and Martin Chad D
Bought by
Volz Andrew R
Home Financials for this Owner
Home Financials are based on the most recent Mortgage that was taken out on this home.
Original Mortgage
$71,600
Interest Rate
5.51%
Mortgage Type
Unknown
Create a Home Valuation Report for This Property
The Home Valuation Report is an in-depth analysis detailing your home's value as well as a comparison with similar homes in the area
Home Values in the Area
Average Home Value in this Area
Purchase History
| Date | Buyer | Sale Price | Title Company |
|---|---|---|---|
| Prouty Amy Michele | -- | None Available | |
| Vandersee Kurt | -- | None Available | |
| Vandersee Kurt | $103,500 | Midwest Community Title | |
| Volz Andrew R | $89,000 | -- |
Source: Public Records
Mortgage History
| Date | Status | Borrower | Loan Amount |
|---|---|---|---|
| Previous Owner | Vandersee Kurt | $104,000 | |
| Previous Owner | Volz Andrew R | $71,600 |
Source: Public Records
Tax History Compared to Growth
Tax History
| Year | Tax Paid | Tax Assessment Tax Assessment Total Assessment is a certain percentage of the fair market value that is determined by local assessors to be the total taxable value of land and additions on the property. | Land | Improvement |
|---|---|---|---|---|
| 2025 | $2,478 | $159,900 | $30,000 | $129,900 |
| 2024 | $2,514 | $150,500 | $27,000 | $123,500 |
| 2023 | $2,514 | $150,500 | $27,000 | $123,500 |
| 2022 | $2,202 | $128,100 | $25,500 | $102,600 |
| 2021 | $2,372 | $115,300 | $21,000 | $94,300 |
| 2020 | $2,372 | $116,100 | $21,000 | $95,100 |
| 2019 | $2,068 | $104,500 | $21,000 | $83,500 |
| 2018 | $2,008 | $104,500 | $21,000 | $83,500 |
| 2017 | $2,155 | $97,800 | $21,000 | $76,800 |
| 2016 | $2,155 | $101,400 | $21,000 | $80,400 |
| 2015 | $2,157 | $101,418 | $21,000 | $80,418 |
| 2014 | $1,972 | $106,901 | $21,000 | $85,901 |
| 2013 | $2,226 | $106,901 | $21,000 | $85,901 |
Source: Public Records
Map
Nearby Homes
- 826 Daniels St NE
- 832 Daniels St NE
- 829 14th St NE
- 1311 I Ave NE
- 420 16th St NE
- 1608 B Ave NE
- 1032 Maplewood Dr NE
- 1532 A Ave NE
- 1046 12th St NE
- 1051 12th St NE
- 1719 C Ave NE
- 517 18th St NE
- 1613 A Ave NE
- 1735 C Ave NE
- 1060 17th St NE
- 8821 Zeppelin Ave NE
- 1815 E Ave NE
- 1746 B Ave NE
- 1703 A Ave NE
- 116 17th St NE
- 1337 G Ave NE
- 1349 G Ave NE Unit 51
- 1329 G Ave NE
- 1346 G Ave NE
- 1338 G Ave NE
- 1356 G Ave NE
- 1325 G Ave NE
- 715 Oakland Rd NE
- 701 Oakland Rd NE
- 801 Oakland Rd NE
- 1330 G Ave NE
- 805 Oakland Rd NE
- 812 Daniels St NE
- 748 Center Point Rd NE
- 1324 G Ave NE
- 811 Oakland Rd NE
- 700 Center Point Rd NE
- 711 Center Point Rd NE
- 820 Daniels St NE
- 813 Oakland Rd NE