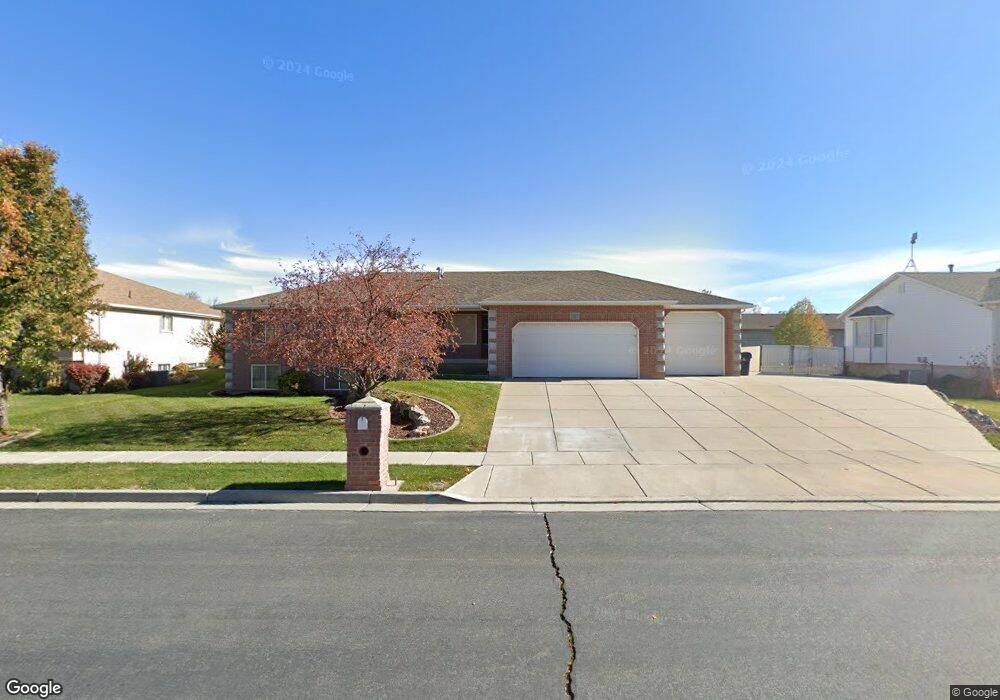
1347 S 2600 W Syracuse, UT 84075
Estimated Value: $607,000 - $683,000
3
Beds
3
Baths
2,116
Sq Ft
$310/Sq Ft
Est. Value
About This Home
This home is located at 1347 S 2600 W, Syracuse, UT 84075 and is currently estimated at $655,515, approximately $309 per square foot. 1347 S 2600 W is a home located in Davis County with nearby schools including Syracuse Elementary School, Syracuse Junior High School, and Syracuse High School.
Ownership History
Date
Name
Owned For
Owner Type
Purchase Details
Closed on
Sep 11, 2020
Sold by
Johnson Kevin R and Johnson Veronica
Bought by
Johnson Kevin and Johnson Veronica
Current Estimated Value
Home Financials for this Owner
Home Financials are based on the most recent Mortgage that was taken out on this home.
Original Mortgage
$265,000
Outstanding Balance
$234,193
Interest Rate
2.8%
Mortgage Type
New Conventional
Estimated Equity
$421,322
Purchase Details
Closed on
Feb 26, 2001
Sold by
Benchmark Real Estate Company
Bought by
Johnson Excavating & Construction Lc and Johnson Kevin R
Home Financials for this Owner
Home Financials are based on the most recent Mortgage that was taken out on this home.
Original Mortgage
$100,607
Interest Rate
7.12%
Mortgage Type
FHA
Purchase Details
Closed on
Jul 10, 1998
Sold by
Benchmark Real Estate Company
Bought by
Johnson Kevin R and Johnson Veronica
Create a Home Valuation Report for This Property
The Home Valuation Report is an in-depth analysis detailing your home's value as well as a comparison with similar homes in the area
Home Values in the Area
Average Home Value in this Area
Purchase History
| Date | Buyer | Sale Price | Title Company |
|---|---|---|---|
| Johnson Kevin | -- | Inwest Title Service | |
| Johnson Excavating & Construction Lc | -- | Founders Title Co | |
| Johnson Kevin R | -- | Founders Title Co |
Source: Public Records
Mortgage History
| Date | Status | Borrower | Loan Amount |
|---|---|---|---|
| Open | Johnson Kevin | $265,000 | |
| Closed | Johnson Excavating & Construction Lc | $100,607 |
Source: Public Records
Tax History Compared to Growth
Tax History
| Year | Tax Paid | Tax Assessment Tax Assessment Total Assessment is a certain percentage of the fair market value that is determined by local assessors to be the total taxable value of land and additions on the property. | Land | Improvement |
|---|---|---|---|---|
| 2025 | $3,301 | $318,450 | $131,088 | $187,362 |
| 2024 | $3,177 | $308,550 | $114,545 | $194,005 |
| 2023 | $3,079 | $545,000 | $159,245 | $385,755 |
| 2022 | $3,276 | $317,900 | $90,809 | $227,091 |
| 2021 | $2,909 | $437,000 | $134,905 | $302,095 |
| 2020 | $2,606 | $379,000 | $114,417 | $264,583 |
| 2019 | $2,487 | $357,000 | $115,639 | $241,361 |
| 2018 | $2,323 | $331,000 | $109,625 | $221,375 |
| 2016 | $2,202 | $164,560 | $41,937 | $122,623 |
| 2015 | $2,146 | $152,735 | $41,937 | $110,798 |
| 2014 | $1,920 | $139,215 | $41,937 | $97,278 |
| 2013 | -- | $149,982 | $34,203 | $115,779 |
Source: Public Records
Map
Nearby Homes
- 2655 S 2430 W Unit 120
- 2665 S 2430 W Unit 118
- 2655 S 2430 W Unit 116
- 2633 S 2430 W Unit 113
- 2614 S 2430 W Unit 106
- 2663 S 2430 W
- 2840 W 1200 S
- 1641 S 2350 W Unit B
- 2679 W Antelope Dr
- 2117 W 1275 S
- 4344 W 1825 S Unit 102
- 4354 W 1825 S Unit 104
- 4348 W 1825 S Unit 103
- 2000 Farmhouse Plan at Legacy Park - Collection
- 2000 Farmhouse Select Plan at Legacy Park - Collection
- San Marino Craftsman Plan at Legacy Park - Estates
- 2050 Craftsman Plan at Legacy Park - Collection
- 1825 Farmhouse Plan at Legacy Park - Collection
- 2200 Garden Plan at Legacy Park - Collection
- Lincoln Farmhouse Plan at Legacy Park - Estates