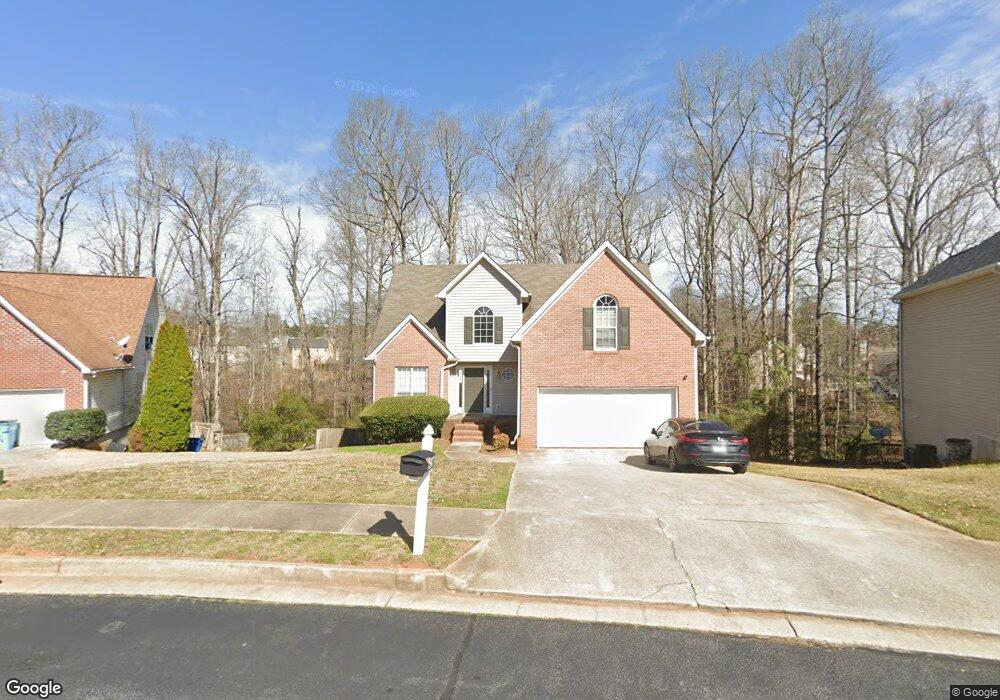
1347 Vine Cir McDonough, GA 30253
Estimated Value: $296,000 - $328,000
4
Beds
3
Baths
1,741
Sq Ft
$177/Sq Ft
Est. Value
About This Home
This home is located at 1347 Vine Cir, McDonough, GA 30253 and is currently estimated at $308,079, approximately $176 per square foot. 1347 Vine Cir is a home located in Henry County with nearby schools including Walnut Creek Elementary School, Eagle's Landing Middle School, and Eagle's Landing High School.
Ownership History
Date
Name
Owned For
Owner Type
Purchase Details
Closed on
Apr 14, 2020
Sold by
Garnett Montavious
Bought by
Garnett Montavious and Maxwell Makiesha L
Current Estimated Value
Home Financials for this Owner
Home Financials are based on the most recent Mortgage that was taken out on this home.
Original Mortgage
$191,468
Outstanding Balance
$170,252
Interest Rate
3.6%
Mortgage Type
FHA
Estimated Equity
$137,827
Purchase Details
Closed on
Oct 6, 2016
Sold by
Dobbs John L and Dobbs Colleen
Bought by
Miller Kent R
Purchase Details
Closed on
Oct 20, 2000
Sold by
John Christian Homes Llc
Bought by
Dobbs John L and Dobbs Colleen
Home Financials for this Owner
Home Financials are based on the most recent Mortgage that was taken out on this home.
Original Mortgage
$154,327
Interest Rate
7.91%
Mortgage Type
FHA
Create a Home Valuation Report for This Property
The Home Valuation Report is an in-depth analysis detailing your home's value as well as a comparison with similar homes in the area
Home Values in the Area
Average Home Value in this Area
Purchase History
| Date | Buyer | Sale Price | Title Company |
|---|---|---|---|
| Garnett Montavious | -- | -- | |
| Garnett Montavious | $195,000 | -- | |
| Miller Kent R | $112,385 | -- | |
| Dobbs John L | $155,600 | -- |
Source: Public Records
Mortgage History
| Date | Status | Borrower | Loan Amount |
|---|---|---|---|
| Open | Garnett Montavious | $191,468 | |
| Closed | Garnett Montavious | $191,468 | |
| Previous Owner | Dobbs John L | $154,327 |
Source: Public Records
Tax History Compared to Growth
Tax History
| Year | Tax Paid | Tax Assessment Tax Assessment Total Assessment is a certain percentage of the fair market value that is determined by local assessors to be the total taxable value of land and additions on the property. | Land | Improvement |
|---|---|---|---|---|
| 2025 | $3,893 | $129,960 | $18,000 | $111,960 |
| 2024 | $3,893 | $132,680 | $18,000 | $114,680 |
| 2023 | $3,449 | $129,960 | $18,000 | $111,960 |
| 2022 | $3,485 | $110,120 | $18,000 | $92,120 |
| 2021 | $2,726 | $78,000 | $13,572 | $64,428 |
| 2020 | $2,889 | $73,400 | $12,000 | $61,400 |
| 2019 | $2,717 | $68,920 | $10,000 | $58,920 |
| 2018 | $2,517 | $63,720 | $10,000 | $53,720 |
| 2016 | $2,152 | $54,200 | $8,000 | $46,200 |
| 2015 | $2,126 | $51,920 | $8,000 | $43,920 |
| 2014 | $2,126 | $51,280 | $8,000 | $43,280 |
Source: Public Records
Map
Nearby Homes
- 168 Vintage Trail
- 309 Bowfin Trail
- 168 Warbler Way
- 1129 Chateau Terrace
- 245 Bald Ave
- 364 Bowfin Trail
- 612 Waterford Ln
- 408 Big Leaf Walk
- 519 Gables Ct Unit 2
- 773 Winbrook Dr
- 422 Old Ivy Path
- Cecil Plan at Campground Crossing
- Sierra Plan at Campground Crossing
- Madison Plan at Campground Crossing
- Nelson Plan at Campground Crossing
- Clayton Plan at Campground Crossing
- Winston Plan at Campground Crossing
- 1739A Highway 42
- 136 Weldon Rd
- 140 Weldon Rd
- 1345 Vine Cir
- 1345 Vine Cir Unit 7
- 1349 Vine Cir
- 1349 Vine Cir Unit 63
- 1158 Chateau Terrace
- 1343 Vine Cir Unit 257
- 1343 Vine Cir
- 1351 Vine Cir
- 1156 Chateau Terrace
- 1346 Vine Cir
- 1352 Vine Cir
- 1154 Chateau Terrace
- 1341 Vine Cir
- 1341 Vine Cir Unit 256
- 1353 Vine Cir
- 1162 Chateau Terrace
- 1340 Vine Cir
- 1152 Chateau Terrace
- 1358 Vine Cir
- 1157 Chateau Terrace