Estimated Value: $645,000 - $880,000
3
Beds
1
Bath
1,106
Sq Ft
$662/Sq Ft
Est. Value
About This Home
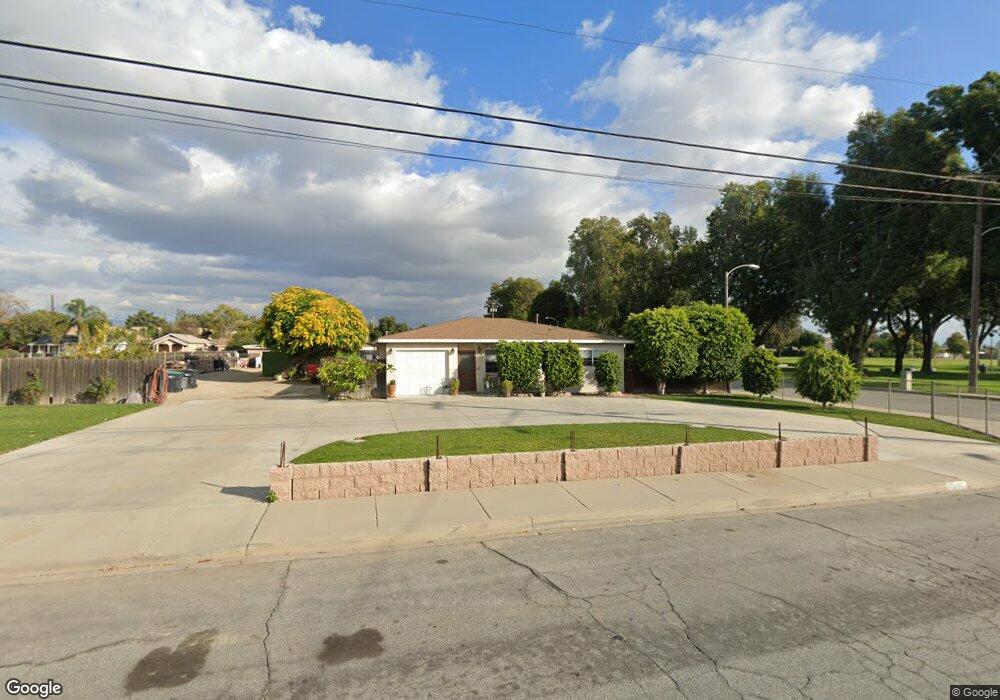
This home is located at 13471 3rd St, Chino, CA 91710 and is currently estimated at $732,395, approximately $662 per square foot. 13471 3rd St is a home located in San Bernardino County with nearby schools including Dickson Elementary, Ramona Junior High School, and Don Antonio Lugo High School.
Ownership History
Date
Name
Owned For
Owner Type
Purchase Details
Closed on
May 3, 2019
Sold by
Aranda Paulette
Bought by
Hernandez Richard E and Sanchez Maria Manuela
Current Estimated Value
Home Financials for this Owner
Home Financials are based on the most recent Mortgage that was taken out on this home.
Original Mortgage
$384,899
Outstanding Balance
$337,022
Interest Rate
4%
Mortgage Type
FHA
Estimated Equity
$395,373
Purchase Details
Closed on
Jun 17, 2004
Sold by
Partida Paul
Bought by
Aranda Paulette
Home Financials for this Owner
Home Financials are based on the most recent Mortgage that was taken out on this home.
Original Mortgage
$62,000
Interest Rate
6.6%
Mortgage Type
Purchase Money Mortgage
Purchase Details
Closed on
Oct 17, 1997
Sold by
Partida Paul
Bought by
Partida Paul and Aranda Paulette
Home Financials for this Owner
Home Financials are based on the most recent Mortgage that was taken out on this home.
Original Mortgage
$45,000
Interest Rate
7.3%
Create a Home Valuation Report for This Property
The Home Valuation Report is an in-depth analysis detailing your home's value as well as a comparison with similar homes in the area
Home Values in the Area
Average Home Value in this Area
Purchase History
| Date | Buyer | Sale Price | Title Company |
|---|---|---|---|
| Hernandez Richard E | $392,000 | Spl Title Services | |
| Aranda Paulette | -- | Investors Title Co Newportbc | |
| Partida Paul | -- | United Title |
Source: Public Records
Mortgage History
| Date | Status | Borrower | Loan Amount |
|---|---|---|---|
| Open | Hernandez Richard E | $384,899 | |
| Previous Owner | Aranda Paulette | $62,000 | |
| Previous Owner | Partida Paul | $45,000 |
Source: Public Records
Tax History Compared to Growth
Tax History
| Year | Tax Paid | Tax Assessment Tax Assessment Total Assessment is a certain percentage of the fair market value that is determined by local assessors to be the total taxable value of land and additions on the property. | Land | Improvement |
|---|---|---|---|---|
| 2025 | $4,751 | $443,403 | $153,049 | $290,354 |
| 2024 | $4,751 | $428,710 | $150,048 | $278,662 |
| 2023 | $4,619 | $420,304 | $147,106 | $273,198 |
| 2022 | $4,592 | $412,063 | $144,222 | $267,841 |
| 2021 | $4,503 | $403,983 | $141,394 | $262,589 |
| 2020 | $4,445 | $399,840 | $139,944 | $259,896 |
| 2019 | $4,133 | $370,898 | $130,005 | $240,893 |
| 2018 | $4,042 | $363,626 | $127,456 | $236,170 |
| 2017 | $3,970 | $356,496 | $124,957 | $231,539 |
| 2016 | $3,710 | $349,506 | $122,507 | $226,999 |
| 2015 | $3,636 | $344,256 | $120,667 | $223,589 |
| 2014 | $3,564 | $337,512 | $118,303 | $219,209 |
Source: Public Records
Map
Nearby Homes
- 4912 G St
- 13123 2nd St
- 13116 3rd St
- 13115 Monte Vista Ave
- 4621 Chino Ave
- 13401 Wisteria Place
- 13139 Derby Ave
- 4814 Ranch Rd
- 12951 Royal Palm Cir
- 4539 Carmen St
- 12939 5th St
- 4524 Carmen St
- 0 C St
- 4449 Carmen St
- 4440 Carmen St
- 13232 Yorkers Place Unit C
- 13640 Norton Ave
- 4862 Lincoln Ave
- 12958 Boston Ave
- 13185 14th St