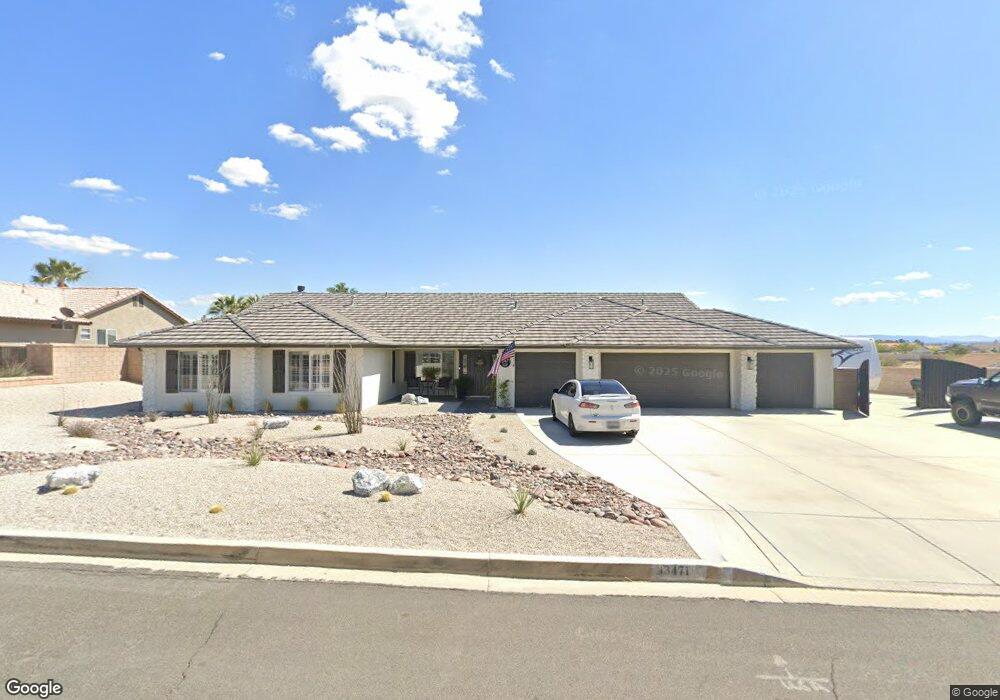
13471 Paraiso Rd Apple Valley, CA 92308
High Desert NeighborhoodEstimated Value: $620,000 - $704,000
4
Beds
3
Baths
2,965
Sq Ft
$224/Sq Ft
Est. Value
About This Home
This home is located at 13471 Paraiso Rd, Apple Valley, CA 92308 and is currently estimated at $663,164, approximately $223 per square foot. 13471 Paraiso Rd is a home located in San Bernardino County with nearby schools including Sitting Bull Academy, Apple Valley High School, and Excelsior Charter School.
Ownership History
Date
Name
Owned For
Owner Type
Purchase Details
Closed on
Jan 14, 2015
Sold by
Moore Michael R
Bought by
Larabell Richard and Larabell Melissa K
Current Estimated Value
Home Financials for this Owner
Home Financials are based on the most recent Mortgage that was taken out on this home.
Original Mortgage
$320,875
Outstanding Balance
$245,048
Interest Rate
3.76%
Mortgage Type
New Conventional
Estimated Equity
$418,116
Purchase Details
Closed on
Jul 13, 2009
Sold by
Coy Arthur Allan
Bought by
Moore Michael R and Moore Manuela T
Home Financials for this Owner
Home Financials are based on the most recent Mortgage that was taken out on this home.
Original Mortgage
$319,113
Interest Rate
5.17%
Mortgage Type
FHA
Purchase Details
Closed on
Sep 14, 1998
Sold by
Clearview Llc
Bought by
Coy Arthur Allan and Coy Penelope Regina
Home Financials for this Owner
Home Financials are based on the most recent Mortgage that was taken out on this home.
Original Mortgage
$149,800
Interest Rate
6.91%
Create a Home Valuation Report for This Property
The Home Valuation Report is an in-depth analysis detailing your home's value as well as a comparison with similar homes in the area
Home Values in the Area
Average Home Value in this Area
Purchase History
| Date | Buyer | Sale Price | Title Company |
|---|---|---|---|
| Larabell Richard | $377,500 | Chicago Title Company | |
| Moore Michael R | $325,000 | Chicago Title Inland Empire | |
| Coy Arthur Allan | $183,000 | Chicago Title |
Source: Public Records
Mortgage History
| Date | Status | Borrower | Loan Amount |
|---|---|---|---|
| Open | Larabell Richard | $320,875 | |
| Previous Owner | Moore Michael R | $319,113 | |
| Previous Owner | Coy Arthur Allan | $149,800 |
Source: Public Records
Tax History
| Year | Tax Paid | Tax Assessment Tax Assessment Total Assessment is a certain percentage of the fair market value that is determined by local assessors to be the total taxable value of land and additions on the property. | Land | Improvement |
|---|---|---|---|---|
| 2025 | $5,316 | $453,698 | $90,740 | $362,958 |
| 2024 | $5,168 | $444,802 | $88,961 | $355,841 |
| 2023 | $5,122 | $436,081 | $87,217 | $348,864 |
| 2022 | $5,046 | $427,531 | $85,507 | $342,024 |
| 2021 | $4,932 | $419,148 | $83,830 | $335,318 |
| 2020 | $4,874 | $414,850 | $82,970 | $331,880 |
| 2019 | $4,786 | $406,716 | $81,343 | $325,373 |
| 2018 | $4,670 | $398,741 | $79,748 | $318,993 |
| 2017 | $4,607 | $390,922 | $78,184 | $312,738 |
| 2016 | $4,471 | $383,257 | $76,651 | $306,606 |
| 2015 | $4,118 | $348,523 | $104,557 | $243,966 |
| 2014 | $4,063 | $341,696 | $102,509 | $239,187 |
Source: Public Records
Map
Nearby Homes
- 13311 Choco Rd
- 13288 Choco Rd
- 19783 Lara Ln
- 13114 Choco Rd
- 13519 Sunset Dr
- 13167 Olathe Rd
- 19978 Eyota Rd
- 13195 Trailwood Way
- 19924 Sunset Ln
- 19185 Cochise Place
- 12971 Lompoc Rd
- 12925 Davona Dale Rd
- 19274 Kanbridge St
- 19265 Kanbridge St
- 13771 Wawona Rd
- 23766 Valley View Ct
- 13823 Wawona Rd
- 13262 Cuyamaca Rd
- 20136 Ottawa Rd
- 13250 Ivanpah Rd
- 13481 Paraiso Rd
- 13390 Paoha Rd
- 13491 Paraiso Rd
- 13470 Paraiso Rd
- 13460 Paraiso Rd
- 13480 Paraiso Rd
- 13380 Paoha Rd
- 13450 Paraiso Rd
- 26565 Paraiso Rd
- 13490 Paraiso Rd
- 13366 Paoha Rd
- 13440 Paraiso Rd
- 19633 Powhatan Rd
- 13427 Paoha Rd
- 19617 Powhatan Rd
- 19649 Powhatan Rd
- 13411 Paoha Rd
- 13350 Paoha Rd
- 13459 Paoha Rd
- 19595 Powhatan Rd
Your Personal Tour Guide
Ask me questions while you tour the home.