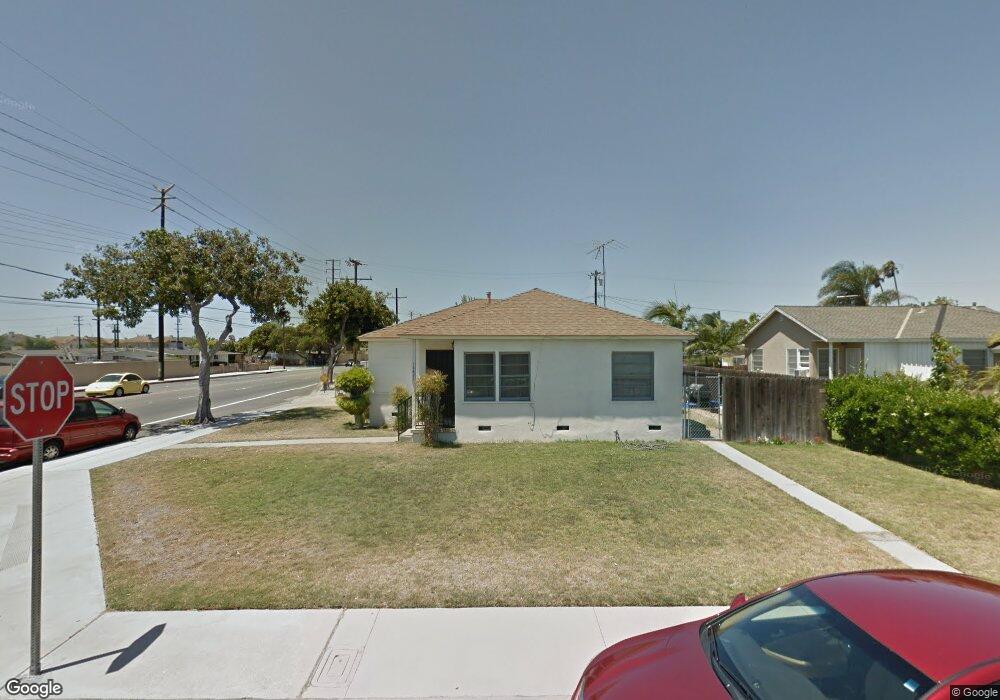
13471 Wilson St Garden Grove, CA 92844
Estimated Value: $706,000 - $1,122,000
3
Beds
1
Bath
1,003
Sq Ft
$885/Sq Ft
Est. Value
About This Home
This home is located at 13471 Wilson St, Garden Grove, CA 92844 and is currently estimated at $887,682, approximately $885 per square foot. 13471 Wilson St is a home located in Orange County with nearby schools including Meairs Elementary School, Warner Middle, and Westminster High School.
Ownership History
Date
Name
Owned For
Owner Type
Purchase Details
Closed on
Jul 1, 2024
Sold by
Favro Esther J
Bought by
Favro Owen O and Favro Esther J
Current Estimated Value
Home Financials for this Owner
Home Financials are based on the most recent Mortgage that was taken out on this home.
Original Mortgage
$506,150
Outstanding Balance
$499,591
Interest Rate
6.94%
Mortgage Type
New Conventional
Estimated Equity
$388,091
Purchase Details
Closed on
May 16, 2024
Sold by
Consuelo M Ramsey Living Trust and Scott Corporon J
Bought by
Favro Esther J
Home Financials for this Owner
Home Financials are based on the most recent Mortgage that was taken out on this home.
Original Mortgage
$506,150
Outstanding Balance
$499,591
Interest Rate
6.94%
Mortgage Type
New Conventional
Estimated Equity
$388,091
Purchase Details
Closed on
Jun 25, 2015
Sold by
Ramsey Consuelo M
Bought by
The Consuelo M Ramsey Living Trust
Create a Home Valuation Report for This Property
The Home Valuation Report is an in-depth analysis detailing your home's value as well as a comparison with similar homes in the area
Home Values in the Area
Average Home Value in this Area
Purchase History
| Date | Buyer | Sale Price | Title Company |
|---|---|---|---|
| Favro Owen O | -- | Lawyers Title | |
| Favro Esther J | -- | Accommodation/Courtesy Recordi | |
| The Consuelo M Ramsey Living Trust | -- | None Available |
Source: Public Records
Mortgage History
| Date | Status | Borrower | Loan Amount |
|---|---|---|---|
| Open | Favro Owen O | $506,150 |
Source: Public Records
Tax History Compared to Growth
Tax History
| Year | Tax Paid | Tax Assessment Tax Assessment Total Assessment is a certain percentage of the fair market value that is determined by local assessors to be the total taxable value of land and additions on the property. | Land | Improvement |
|---|---|---|---|---|
| 2025 | $6,418 | $515,277 | $469,918 | $45,359 |
| 2024 | $6,418 | $728,280 | $681,257 | $47,023 |
| 2023 | $916 | $49,162 | $24,900 | $24,262 |
| 2022 | $897 | $48,199 | $24,412 | $23,787 |
| 2021 | $880 | $47,254 | $23,933 | $23,321 |
| 2020 | $869 | $46,770 | $23,688 | $23,082 |
| 2019 | $862 | $45,853 | $23,223 | $22,630 |
| 2018 | $855 | $44,954 | $22,767 | $22,187 |
| 2017 | $831 | $44,073 | $22,321 | $21,752 |
| 2016 | $807 | $43,209 | $21,883 | $21,326 |
| 2015 | $793 | $42,560 | $21,554 | $21,006 |
| 2014 | $775 | $41,727 | $21,132 | $20,595 |
Source: Public Records
Map
Nearby Homes
- 8442 Trask Ave
- 8197 Jasmine Ave
- 13502 Jackson St
- 13252 Newland St Unit A-D
- 8569 Edgebrook Dr
- 8520 Lake Knoll Ave Unit B
- 13141 Monroe St
- 13782 Newland St
- 13175 Creek View Dr Unit F
- 13082 Monroe St
- 8202 19th St
- 8196 18th St
- 7811 24th St
- 13762 Pacific Ave
- 8800 W Garden Grove Blvd Unit 2
- 13532 Richardson Way
- 12941 Josephine St
- 12892 Adelle St
- 12931 Josephine St
- 8784 Hewitt Place Unit 12
- 13451 Wilson St
- 13472 Jefferson St
- 13441 Wilson St
- 13452 Jefferson St
- 13502 Medora Place
- 13431 Wilson St
- 13442 Jefferson St
- 13472 Wilson St
- 13452 Wilson St
- 13502 Jefferson St
- 13521 Medora Place
- 13442 Wilson St
- 13522 Medora Place
- 13421 Wilson St
- 13422 Jefferson St
- 8271 Trask Ave
- 13432 Wilson St
- 13532 Medora Place
- 13522 Jefferson St
- 13451 Jefferson St