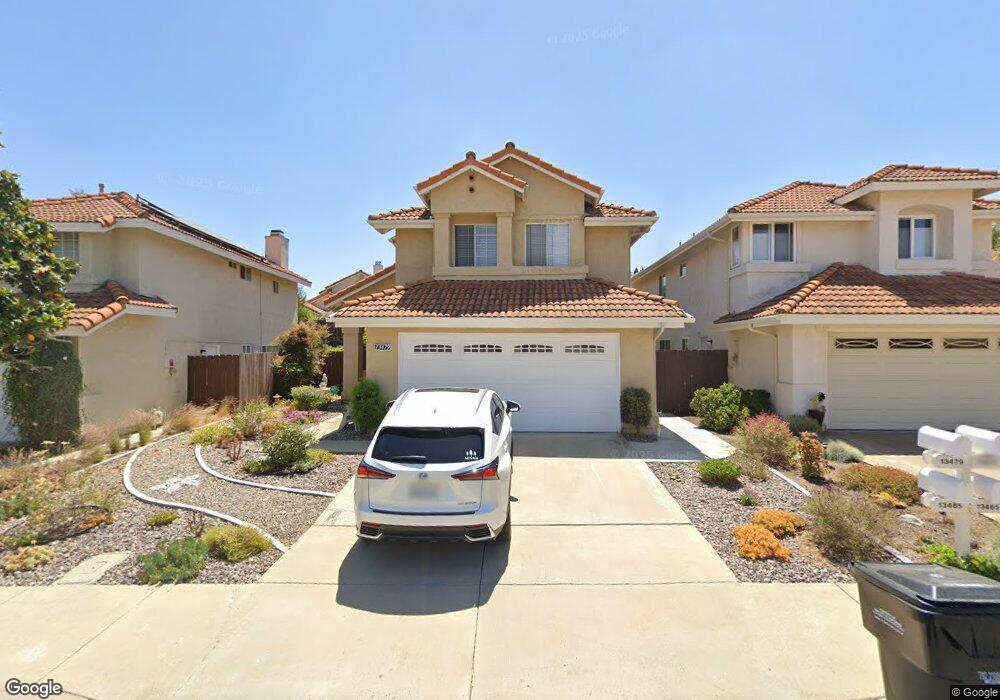
13479 Bidwell Ct San Diego, CA 92129
Rancho Peñasquitos NeighborhoodEstimated Value: $1,286,000 - $1,573,000
4
Beds
3
Baths
1,802
Sq Ft
$797/Sq Ft
Est. Value
About This Home
This home is located at 13479 Bidwell Ct, San Diego, CA 92129 and is currently estimated at $1,437,055, approximately $797 per square foot. 13479 Bidwell Ct is a home located in San Diego County with nearby schools including Deer Canyon Elementary School, Mesa Verde Middle School, and Westview High School.
Ownership History
Date
Name
Owned For
Owner Type
Purchase Details
Closed on
Jul 13, 2017
Sold by
Tong Michael Kwok and Tong Kitty Cheuk
Bought by
Tong Michael Kwok and Tong Kitty Cheuk
Current Estimated Value
Purchase Details
Closed on
Oct 7, 1997
Sold by
Cavanaugh Paul R and Cavanaugh Victoria J
Bought by
Tong Michael K and Tong Kitty C
Home Financials for this Owner
Home Financials are based on the most recent Mortgage that was taken out on this home.
Original Mortgage
$165,000
Interest Rate
6.93%
Purchase Details
Closed on
Jun 8, 1995
Sold by
Emch Mark A and Emch Mary Ann V
Bought by
Cavanaugh Paul R and Cavanaugh Victoria J
Home Financials for this Owner
Home Financials are based on the most recent Mortgage that was taken out on this home.
Original Mortgage
$203,000
Interest Rate
7.59%
Mortgage Type
Assumption
Purchase Details
Closed on
Jul 22, 1988
Create a Home Valuation Report for This Property
The Home Valuation Report is an in-depth analysis detailing your home's value as well as a comparison with similar homes in the area
Home Values in the Area
Average Home Value in this Area
Purchase History
| Date | Buyer | Sale Price | Title Company |
|---|---|---|---|
| Tong Michael Kwok | -- | None Available | |
| Tong Michael K | $221,000 | Chicago Title Co | |
| Cavanaugh Paul R | $205,000 | Commonwealth Land Title Co | |
| -- | $162,100 | -- |
Source: Public Records
Mortgage History
| Date | Status | Borrower | Loan Amount |
|---|---|---|---|
| Previous Owner | Tong Michael K | $165,000 | |
| Previous Owner | Cavanaugh Paul R | $203,000 |
Source: Public Records
Tax History Compared to Growth
Tax History
| Year | Tax Paid | Tax Assessment Tax Assessment Total Assessment is a certain percentage of the fair market value that is determined by local assessors to be the total taxable value of land and additions on the property. | Land | Improvement |
|---|---|---|---|---|
| 2025 | $3,549 | $352,854 | $163,357 | $189,497 |
| 2024 | $3,549 | $345,936 | $160,154 | $185,782 |
| 2023 | $3,467 | $339,154 | $157,014 | $182,140 |
| 2022 | $3,400 | $332,505 | $153,936 | $178,569 |
| 2021 | $3,333 | $325,986 | $150,918 | $175,068 |
| 2020 | $3,303 | $322,644 | $149,371 | $173,273 |
| 2019 | $3,240 | $316,319 | $146,443 | $169,876 |
| 2018 | $3,172 | $310,118 | $143,572 | $166,546 |
| 2017 | $3,107 | $304,038 | $140,757 | $163,281 |
| 2016 | $3,035 | $298,078 | $137,998 | $160,080 |
| 2015 | $2,989 | $293,602 | $135,926 | $157,676 |
| 2014 | $2,917 | $287,852 | $133,264 | $154,588 |
Source: Public Records
Map
Nearby Homes
- 8730 Twin Trails Dr
- 13894 Camino Del Suelo
- 8985 Talca Ct
- 13146 Thunderhead St
- 12740 Prairie Dog Ave
- 12880 War Horse St
- 13907 Bruyere Ct
- 8754 Park Run Rd
- 8672 Creekwood Ln
- 8862 La Cartera St
- 13045 Texana St
- 7855 Via Belfiore Unit 1
- 9302 Twin Trails Dr Unit 204
- 13445 Appalachian Way
- 9342 Twin Trails Dr Unit 303
- 14305 El Vestido St
- 13411 Appalachian Way
- 12573 Brickellia St
- 9120 Meadowrun Place
- 9458 Twin Trails Dr Unit 205
- 13471 Bidwell Ct
- 13485 Bidwell Ct
- 13465 Bidwell Ct
- 13489 Bidwell Ct Unit 3
- 13480 Benbow Ct
- 13474 Benbow Ct
- 13484 Benbow Ct
- 13455 Bidwell Ct
- 13468 Benbow Ct Unit 3
- 13490 Benbow Ct
- 13495 Bidwell Ct
- 13472 Bidwell Ct
- 13480 Bidwell Ct
- 13466 Bidwell Ct
- 13462 Benbow Ct
- 13445 Bidwell Ct
- 13488 Bidwell Ct
- 13496 Benbow Ct
- 13458 Bidwell Ct
- 13425 Bidwell Ct