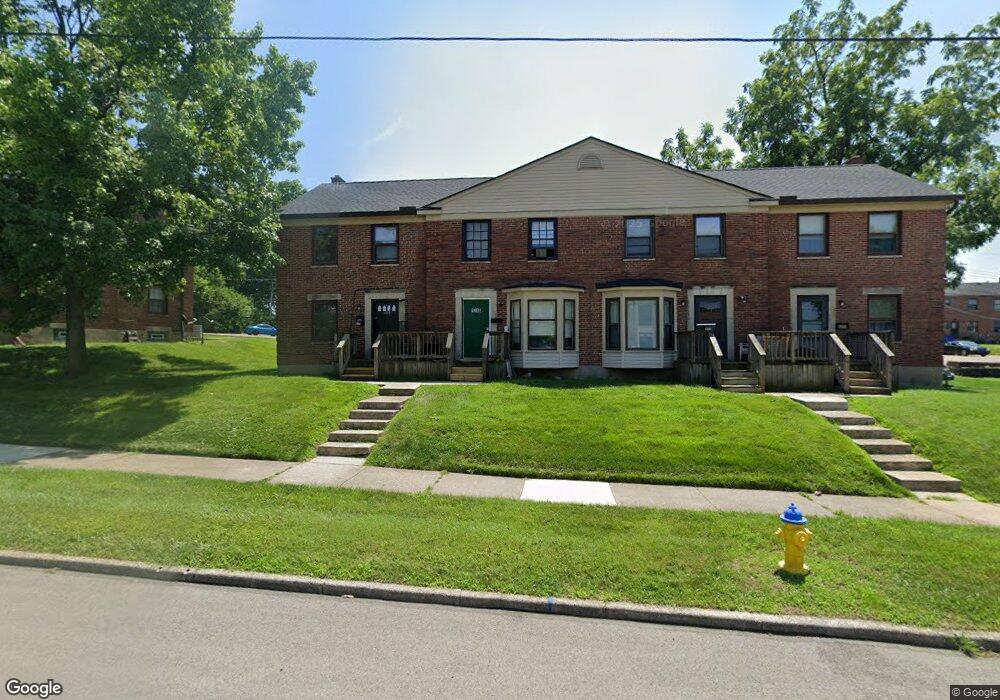
1348 Huffman Ave Dayton, OH 45403
Eastern Hills NeighborhoodEstimated Value: $66,000 - $91,000
2
Beds
1
Bath
900
Sq Ft
$88/Sq Ft
Est. Value
About This Home
This home is located at 1348 Huffman Ave, Dayton, OH 45403 and is currently estimated at $79,320, approximately $88 per square foot. 1348 Huffman Ave is a home located in Montgomery County with nearby schools including Ruskin Elementary School, Kiser Elementary, and Horizon Science Academy Dayton Downtown.
Ownership History
Date
Name
Owned For
Owner Type
Purchase Details
Closed on
Aug 26, 2022
Sold by
Ware Joshua
Bought by
Williams Antonio
Current Estimated Value
Purchase Details
Closed on
May 31, 2022
Sold by
Andrew Partenach
Bought by
Ware Joshua
Purchase Details
Closed on
Jul 15, 2011
Sold by
Noah Land Llc
Bought by
Partenach Andrew
Purchase Details
Closed on
May 8, 2007
Sold by
Deutsche Bank Trust Co Americas
Bought by
Noah Land Llc
Purchase Details
Closed on
Sep 22, 2006
Sold by
Austin Joan L
Bought by
Deutsche Bank Trust Co Americas and Meritage Mortgage Loan Trust 2005-1
Purchase Details
Closed on
Dec 28, 2004
Sold by
Harrison Katharine L and Harrison Jack
Bought by
Austin Joan L
Home Financials for this Owner
Home Financials are based on the most recent Mortgage that was taken out on this home.
Original Mortgage
$36,550
Interest Rate
8.99%
Mortgage Type
Fannie Mae Freddie Mac
Purchase Details
Closed on
Mar 19, 1998
Sold by
Mullikin Jerry W
Bought by
Mullikin Joan L
Create a Home Valuation Report for This Property
The Home Valuation Report is an in-depth analysis detailing your home's value as well as a comparison with similar homes in the area
Home Values in the Area
Average Home Value in this Area
Purchase History
| Date | Buyer | Sale Price | Title Company |
|---|---|---|---|
| Williams Antonio | -- | -- | |
| Ware Joshua | -- | None Listed On Document | |
| Partenach Andrew | -- | None Available | |
| Noah Land Llc | $3,000 | Sovereign Title Agency Llc | |
| Deutsche Bank Trust Co Americas | $28,050 | None Available | |
| Austin Joan L | $37,900 | None Available | |
| Mullikin Joan L | -- | -- |
Source: Public Records
Mortgage History
| Date | Status | Borrower | Loan Amount |
|---|---|---|---|
| Previous Owner | Austin Joan L | $36,550 |
Source: Public Records
Tax History Compared to Growth
Tax History
| Year | Tax Paid | Tax Assessment Tax Assessment Total Assessment is a certain percentage of the fair market value that is determined by local assessors to be the total taxable value of land and additions on the property. | Land | Improvement |
|---|---|---|---|---|
| 2024 | $594 | $10,300 | $1,960 | $8,340 |
| 2023 | $594 | $10,300 | $1,960 | $8,340 |
| 2022 | $782 | $10,300 | $1,960 | $8,340 |
| 2021 | $778 | $10,300 | $1,960 | $8,340 |
| 2020 | $776 | $10,300 | $1,960 | $8,340 |
| 2019 | $1,088 | $13,140 | $2,800 | $10,340 |
| 2018 | $1,090 | $13,140 | $2,800 | $10,340 |
| 2017 | $1,082 | $13,140 | $2,800 | $10,340 |
| 2016 | $1,090 | $12,590 | $2,800 | $9,790 |
| 2015 | $1,031 | $12,590 | $2,800 | $9,790 |
| 2014 | $1,031 | $12,590 | $2,800 | $9,790 |
| 2012 | -- | $7,760 | $2,800 | $4,960 |
Source: Public Records
Map
Nearby Homes
- 1323 Huffman Ave
- 631 Greenlawn Ave
- 515 Heiss Ave Unit 515-517
- 223 Pleasant Ave
- 40 Klee Ave
- 715 Gondert Ave
- 227 Livingston Ave Unit 225
- 520 S Smithville Rd
- 1614 Huffman Ave Unit 1612
- 404 S Smithville Rd
- 115 Oaklawn Ave
- 1345 Jordan Ave
- 763 Greenlawn Ave
- 1626 Darst Ave
- 1629 Suman Ave
- 153 S Hedges St
- 161 S Harbine Ave
- 1620 Gondert Ave Unit 1618
- 1620 Gondert Ave
- 133 Linsan Ct
- 1346 Huffman Ave
- 1350 Huffman Ave
- 1344 Huffman Ave
- 1354 Huffman Ave
- 1356 Huffman Ave
- 1340 Huffman Ave
- 1358 Huffman Ave
- 1338 Huffman Ave
- 1360 Huffman Ave
- 1336 Huffman Ave
- 1334 Huffman Ave
- 30 Seminary Ave
- 30 Seminary Ave
- 30 Seminary Ave
- 30 Seminary Ave
- 30 Seminary Ave
- 30 Seminary Ave
- 30 Seminary Ave
- 30 Seminary Ave Unit D
- 30 Seminary Ave Unit B