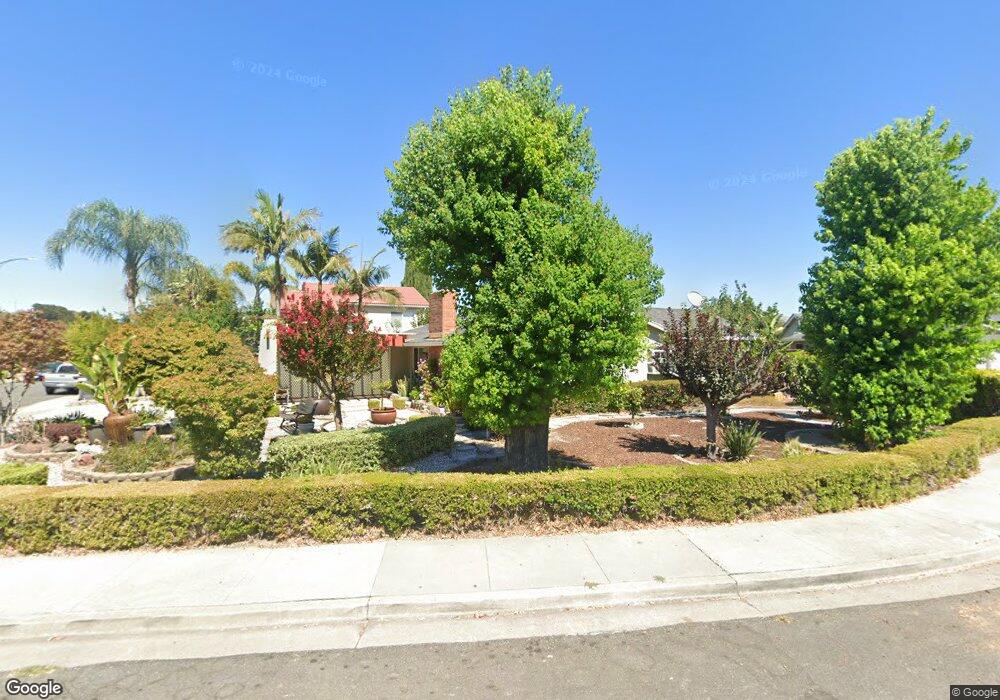
1348 Old Stone Place San Jose, CA 95132
Old Port NeighborhoodEstimated Value: $1,254,000 - $1,464,000
3
Beds
2
Baths
1,041
Sq Ft
$1,298/Sq Ft
Est. Value
About This Home
This home is located at 1348 Old Stone Place, San Jose, CA 95132 and is currently estimated at $1,351,077, approximately $1,297 per square foot. 1348 Old Stone Place is a home located in Santa Clara County with nearby schools including Cherrywood Elementary School, Sierramont Middle School, and Independence High School.
Ownership History
Date
Name
Owned For
Owner Type
Purchase Details
Closed on
Jun 27, 1997
Sold by
Baluyot Rodrigo and Baluyot Grace M
Bought by
Baluyot Rodrigo and Baluyot Grace L
Current Estimated Value
Home Financials for this Owner
Home Financials are based on the most recent Mortgage that was taken out on this home.
Original Mortgage
$198,500
Interest Rate
7.92%
Purchase Details
Closed on
Jun 14, 1996
Sold by
Baluyot Rodrigo and Baluyot Grace
Bought by
Baluyot Rodrigo and Baluyot Grace
Home Financials for this Owner
Home Financials are based on the most recent Mortgage that was taken out on this home.
Original Mortgage
$100,000
Interest Rate
8.25%
Purchase Details
Closed on
May 17, 1996
Sold by
Lin Hon Tu and Lin Syou Hwa
Bought by
Baluyot Rodrigo and Baluyot Grace
Home Financials for this Owner
Home Financials are based on the most recent Mortgage that was taken out on this home.
Original Mortgage
$100,000
Interest Rate
8.25%
Create a Home Valuation Report for This Property
The Home Valuation Report is an in-depth analysis detailing your home's value as well as a comparison with similar homes in the area
Home Values in the Area
Average Home Value in this Area
Purchase History
| Date | Buyer | Sale Price | Title Company |
|---|---|---|---|
| Baluyot Rodrigo | -- | Golden California Title Co | |
| Baluyot Rodrigo | $46,000 | American Title Ins Co | |
| Baluyot Rodrigo | $19,000 | -- |
Source: Public Records
Mortgage History
| Date | Status | Borrower | Loan Amount |
|---|---|---|---|
| Closed | Baluyot Rodrigo | $198,500 | |
| Closed | Baluyot Rodrigo | $100,000 |
Source: Public Records
Tax History Compared to Growth
Tax History
| Year | Tax Paid | Tax Assessment Tax Assessment Total Assessment is a certain percentage of the fair market value that is determined by local assessors to be the total taxable value of land and additions on the property. | Land | Improvement |
|---|---|---|---|---|
| 2025 | $5,810 | $342,757 | $124,576 | $218,181 |
| 2024 | $5,810 | $336,037 | $122,134 | $213,903 |
| 2023 | $5,676 | $329,449 | $119,740 | $209,709 |
| 2022 | $5,632 | $322,991 | $117,393 | $205,598 |
| 2021 | $5,420 | $316,659 | $115,092 | $201,567 |
| 2020 | $5,232 | $313,413 | $113,912 | $199,501 |
| 2019 | $5,027 | $307,269 | $111,679 | $195,590 |
| 2018 | $4,941 | $301,245 | $109,490 | $191,755 |
| 2017 | $4,950 | $295,340 | $107,344 | $187,996 |
| 2016 | $4,743 | $289,550 | $105,240 | $184,310 |
| 2015 | $4,681 | $285,202 | $103,660 | $181,542 |
| 2014 | $4,076 | $279,616 | $101,630 | $177,986 |
Source: Public Records
Map
Nearby Homes
- 2520 Amaryl Dr
- 2129 Doxey Dr
- 2210 Renfrew Ct
- 2064 Wizard Ct
- 1332 Cabrillo Ave
- 2280 Zoria Cir
- 2790 Longford Dr
- 1997 Lowney Way
- 1599 Clampett Way
- 1968 Nutmeg Ct
- 1199 Morrill Ave
- 1263 Flickinger Ave
- 1260 Sierra Village Place
- 1464 Lucena Ct
- 2616 Sierra Village Ct
- 1062 Rymar Place
- 1809 Sageland Dr
- 1373 Ferrel Ct
- 1690 Coraltree Place
- 1116 Genco Terrace
- 2310 Old Post Way
- 1344 Old Stone Place
- 2316 Old Post Way
- 1338 Old Stone Place
- 2322 Old Post Way
- 1349 Old Stone Place
- 1345 Old Stone Place
- 1361 Old Stone Place
- 1337 Old Stone Place
- 1365 Old Stone Place
- 1357 Old Stone Place
- 1341 Old Stone Place
- 1353 Old Stone Place
- 1351 Old Park Place
- 1369 Old Stone Place
- 1357 Old Park Place
- 1339 Old Stone Way
- 1345 Old Park Place
- 1363 Old Park Place
- 1341 Old Park Place