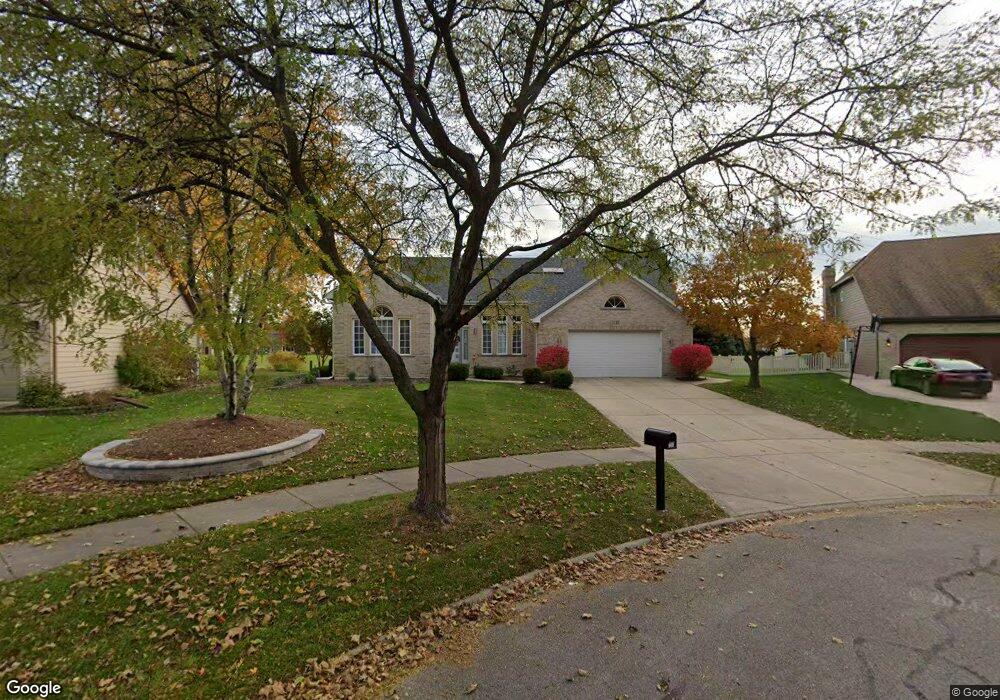
1348 Saxon Ln Naperville, IL 60564
Ashbury NeighborhoodEstimated Value: $708,000 - $775,000
3
Beds
3
Baths
3,000
Sq Ft
$251/Sq Ft
Est. Value
About This Home
This home is located at 1348 Saxon Ln, Naperville, IL 60564 and is currently estimated at $752,513, approximately $250 per square foot. 1348 Saxon Ln is a home located in Will County with nearby schools including Patterson Elementary School, Gordon Gregory Middle School, and Neuqua Valley High School.
Ownership History
Date
Name
Owned For
Owner Type
Purchase Details
Closed on
Sep 16, 2024
Sold by
Strand Andrea M
Bought by
Andrea M Strand Trust and Strand
Current Estimated Value
Purchase Details
Closed on
Sep 8, 2022
Sold by
Strand Ryan R
Bought by
Strand Andrea M
Purchase Details
Closed on
May 3, 2017
Sold by
Fall Rosalie M
Bought by
Strand Ryan R and Strand Andrea M
Home Financials for this Owner
Home Financials are based on the most recent Mortgage that was taken out on this home.
Original Mortgage
$360,000
Interest Rate
3.99%
Mortgage Type
New Conventional
Purchase Details
Closed on
Oct 29, 1991
Bought by
Fall James A Ros
Create a Home Valuation Report for This Property
The Home Valuation Report is an in-depth analysis detailing your home's value as well as a comparison with similar homes in the area
Home Values in the Area
Average Home Value in this Area
Purchase History
| Date | Buyer | Sale Price | Title Company |
|---|---|---|---|
| Andrea M Strand Trust | -- | None Listed On Document | |
| Strand Andrea M | -- | -- | |
| Strand Ryan R | $400,000 | Fidelity National Title | |
| Fall James A Ros | $242,500 | -- |
Source: Public Records
Mortgage History
| Date | Status | Borrower | Loan Amount |
|---|---|---|---|
| Previous Owner | Strand Ryan R | $360,000 |
Source: Public Records
Tax History
| Year | Tax Paid | Tax Assessment Tax Assessment Total Assessment is a certain percentage of the fair market value that is determined by local assessors to be the total taxable value of land and additions on the property. | Land | Improvement |
|---|---|---|---|---|
| 2024 | $13,160 | $208,912 | $65,131 | $143,781 |
| 2023 | $13,160 | $184,551 | $57,536 | $127,015 |
| 2022 | $12,157 | $173,794 | $54,428 | $119,366 |
| 2021 | $11,619 | $165,518 | $51,836 | $113,682 |
| 2020 | $11,399 | $162,896 | $51,015 | $111,881 |
| 2019 | $11,203 | $158,305 | $49,577 | $108,728 |
| 2018 | $10,861 | $155,993 | $48,487 | $107,506 |
| 2017 | $10,685 | $151,966 | $47,235 | $104,731 |
| 2016 | $10,657 | $148,695 | $46,218 | $102,477 |
| 2015 | $10,644 | $142,976 | $44,440 | $98,536 |
| 2014 | $10,644 | $138,271 | $44,440 | $93,831 |
| 2013 | $10,644 | $138,271 | $44,440 | $93,831 |
Source: Public Records
Map
Nearby Homes
- 3027 Brossman St
- 3720 Mandeville Ln
- 3111 Landore Dr
- 1107 Conan Doyle Rd Unit 2
- 3740 Caine Dr
- 1123 Thackery Ln
- 3804 Relstar Ct
- 1126 Starlite Ct
- 1736 Robert Ln
- 2255 Wendt Cir
- 820 Spring Creek Cir
- 28W555 Leverenz Rd
- 28W587 Leverenz Rd
- 2344 Corn Lily Rd
- 2828 Bluewater Cir
- 3520 Timber Creek Ln
- 719 Eagle Brook Ln Unit 4
- 723 Mesa Dr
- 1137 Crimson Ct
- 2736 Bluewater Cir
- 1344 Saxon Ln
- 1352 Saxon Ln
- 1340 Saxon Ln
- 1356 Saxon Ln Unit 1
- 1360 Saxon Ln
- 1336 Saxon Ln
- 3424 Lawrence Dr
- 1351 Saxon Ln
- 3420 Lawrence Dr
- 1339 Saxon Ln
- 3416 Lawrence Dr
- 1363 Saxon Ln
- 1332 Saxon Ln
- 1364 Saxon Ln
- 1531 Carlyle Rd
- 1527 Carlyle Rd
- 1335 Saxon Ln Unit 1
- 1535 Carlyle Rd
- 1523 Carlyle Rd
- 3412 Lawrence Dr
Your Personal Tour Guide
Ask me questions while you tour the home.