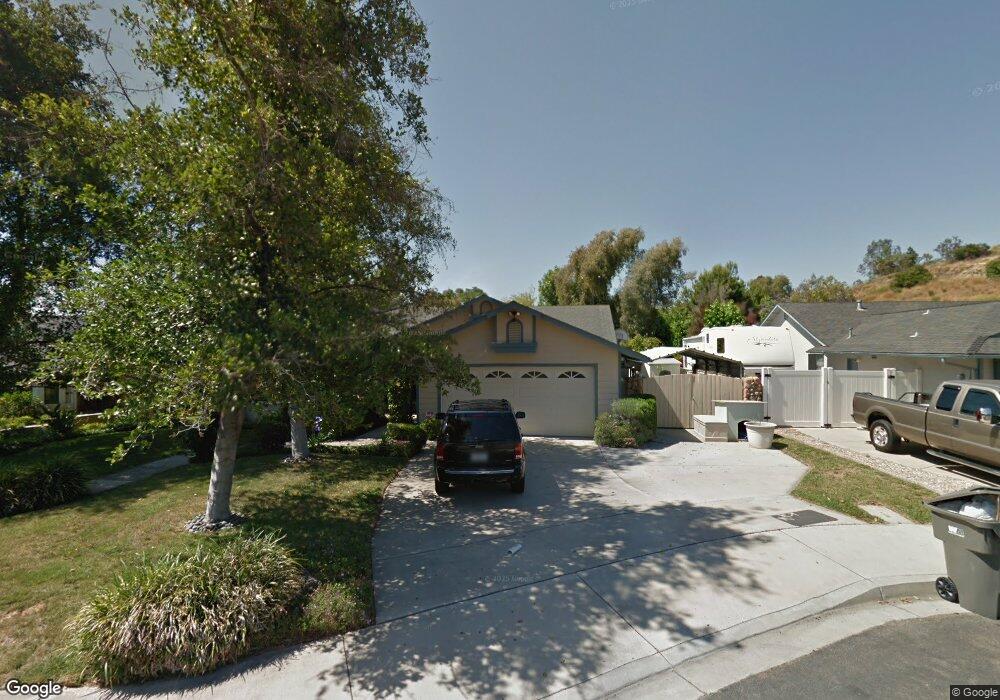
13486 Sohail St Lakeside, CA 92040
Lakeside AreaEstimated Value: $845,916 - $918,000
About This Home
This home is located at 13486 Sohail St, Lakeside, CA 92040 and is currently estimated at $868,979, approximately $527 per square foot. 13486 Sohail St is a home located in San Diego County with nearby schools including Lakeview Elementary School, Tierra Del Sol Middle School, and El Capitan High School.
Ownership History
We collect this data history from publicly available records. To have your information removed, we recommend requesting removal directly through your county’s website.
Purchase Details
Home Financials for this Owner
Home Financials are based on the most recent Mortgage that was taken out on this home.Purchase Details
Home Financials for this Owner
Home Financials are based on the most recent Mortgage that was taken out on this home.Purchase Details
Purchase Details
Home Financials for this Owner
Home Financials are based on the most recent Mortgage that was taken out on this home.Purchase Details
Purchase Details
Home Financials for this Owner
Home Financials are based on the most recent Mortgage that was taken out on this home.Purchase Details
Home Financials for this Owner
Home Financials are based on the most recent Mortgage that was taken out on this home.Purchase Details
Home Financials for this Owner
Home Financials are based on the most recent Mortgage that was taken out on this home.Purchase Details
Purchase Details
Purchase Details
Purchase History
We collect this data history from publicly available records. To have your information removed, we recommend requesting removal directly through your county’s website.
| Date | Buyer | Sale Price | Title Company |
|---|---|---|---|
| -- | California Title Co | ||
| -- | California Title Company | ||
| -- | Wfg Title Co Of Ca San Diego | ||
| -- | Accommodation | ||
| -- | None Available | ||
| $397,500 | Ticor Title Company Of Ca | ||
| -- | Chicago Title Company | ||
| -- | Chicago Title Company | ||
| -- | Chicago Title Co | ||
| -- | Chicago Title Co | ||
| -- | Fidelity National Title Co | ||
| -- | -- | ||
| -- | -- | ||
| $193,000 | Southland Title Corporation | ||
| $174,600 | -- |
Mortgage History
We collect this data history from publicly available records. To have your information removed, we recommend requesting removal directly through your county’s website.
| Date | Status | Borrower | Loan Amount |
|---|---|---|---|
| Open | $404,401 | ||
| Closed | $406,550 | ||
| Closed | $430,000 | ||
| Closed | $385,000 | ||
| Closed | $385,000 | ||
| Closed | $345,720 | ||
| Previous Owner | $354,375 | ||
| Previous Owner | $331,304 | ||
| Previous Owner | $330,000 | ||
| Previous Owner | $35,000 | ||
| Previous Owner | $112,000 | ||
| Previous Owner | $110,000 | ||
| Previous Owner | $35,000 |
Tax History
We collect this data history from publicly available records. To have your information removed, we recommend requesting removal directly through your county’s website.
| Year | Tax Paid | Tax Assessment Tax Assessment Total Assessment is a certain percentage of the fair market value that is determined by local assessors to be the total taxable value of land and additions on the property. | Land | Improvement |
|---|---|---|---|---|
| 2026 | $6,796 | $519,435 | $193,368 | $326,067 |
| 2025 | $6,610 | $509,251 | $189,577 | $319,674 |
| 2024 | $6,610 | $499,266 | $185,860 | $313,406 |
| 2023 | $6,364 | $489,477 | $182,216 | $307,261 |
| 2022 | $6,244 | $479,881 | $178,644 | $301,237 |
| 2021 | $6,161 | $470,473 | $175,142 | $295,331 |
| 2020 | $6,055 | $465,650 | $173,347 | $292,303 |
| 2019 | $5,941 | $456,521 | $169,949 | $286,572 |
| 2018 | $5,825 | $447,570 | $166,617 | $280,953 |
| 2017 | $5,706 | $438,795 | $163,350 | $275,445 |
| 2016 | $5,524 | $430,193 | $160,148 | $270,045 |
| 2015 | $5,490 | $423,732 | $157,743 | $265,989 |
| 2014 | $5,229 | $415,433 | $154,654 | $260,779 |
Map
- 13525 Sunny Ln
- 13589 Sohail St
- 9622 Lakeview Rd
- 13309 Lakeview Way
- 13256 Lindo Ln
- 13314 Lakeshore Dr
- 13107 Lindo Ln
- 13140 Lakeshore Dr
- 13323 Appaloosa Dr
- 10020 Pino Dr
- 12886 Castle Court Dr
- 13104 Lakeview Granada Dr
- 13312 Mapleview St
- 9903 Lindo Lake Place
- 9209 Adlai Rd
- 12706 Julian Ave
- 9500 Harritt Rd Unit SPC 189
- 9500 Harritt Rd
- 9500 Harritt Rd
- 9500 Harritt Rd
- 13472 Sohail St
- 13494 Sohail St
- 13495 Khuram St
- 13458 Sohail St
- 13506 Sohail St
- 13499 Khuram St
- 13473 Khuram St
- 13517 Sohail St
- 13444 Sohail St
- 13457 Sohail St
- 13479 Sohail St
- 13457 Khuram St
- 13498 Khuram St
- 13449 Sohail St
- 9660 Lower Green Glen
- 13518 Sohail St
- 9659 Lower Green Glen
- 13430 Sohail St
- 9647 Lower Green Glen
- 13451 Khuram St
Ask me questions while you tour the home.