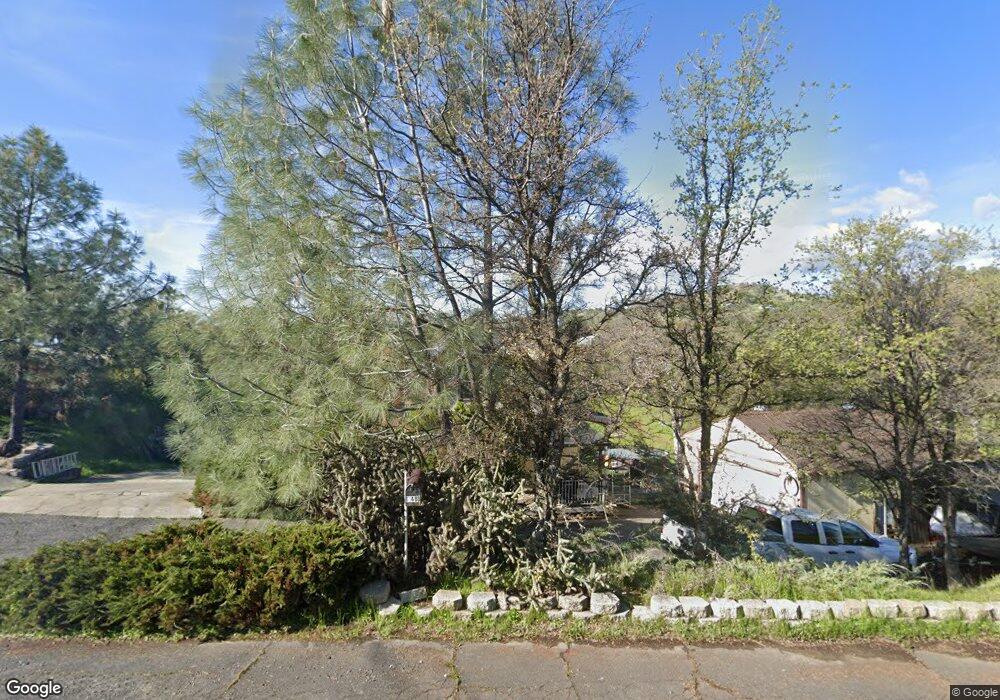
13488 Colina Way La Grange, CA 95329
Estimated Value: $193,000 - $376,000
3
Beds
2
Baths
1,672
Sq Ft
$175/Sq Ft
Est. Value
About This Home
This home is located at 13488 Colina Way, La Grange, CA 95329 and is currently estimated at $292,850, approximately $175 per square foot. 13488 Colina Way is a home located in Tuolumne County.
Ownership History
Date
Name
Owned For
Owner Type
Purchase Details
Closed on
Mar 15, 2021
Sold by
Nomelli Jeanah M
Bought by
Nomelli Jeanah M and Nomelli Anthony A
Current Estimated Value
Home Financials for this Owner
Home Financials are based on the most recent Mortgage that was taken out on this home.
Original Mortgage
$102,000
Outstanding Balance
$91,436
Interest Rate
2.7%
Mortgage Type
New Conventional
Estimated Equity
$201,414
Purchase Details
Closed on
Jul 15, 2011
Sold by
Nomelli Anthony
Bought by
Nomelli Jeanah M
Home Financials for this Owner
Home Financials are based on the most recent Mortgage that was taken out on this home.
Original Mortgage
$112,084
Interest Rate
4.46%
Mortgage Type
FHA
Purchase Details
Closed on
Apr 11, 2011
Sold by
Erickson Roger D
Bought by
Erickson Roger D and Erickson Jesse
Create a Home Valuation Report for This Property
The Home Valuation Report is an in-depth analysis detailing your home's value as well as a comparison with similar homes in the area
Home Values in the Area
Average Home Value in this Area
Purchase History
| Date | Buyer | Sale Price | Title Company |
|---|---|---|---|
| Nomelli Jeanah M | -- | Chicago Title Company | |
| Nomelli Jeanah M | -- | Old Republic Title Company | |
| Nomelli Jeanah M | $115,000 | Old Republic Title Company | |
| Erickson Roger D | -- | None Available |
Source: Public Records
Mortgage History
| Date | Status | Borrower | Loan Amount |
|---|---|---|---|
| Open | Nomelli Jeanah M | $102,000 | |
| Closed | Nomelli Jeanah M | $112,084 |
Source: Public Records
Tax History Compared to Growth
Tax History
| Year | Tax Paid | Tax Assessment Tax Assessment Total Assessment is a certain percentage of the fair market value that is determined by local assessors to be the total taxable value of land and additions on the property. | Land | Improvement |
|---|---|---|---|---|
| 2025 | $1,553 | $144,431 | $31,394 | $113,037 |
| 2024 | $1,553 | $141,600 | $30,779 | $110,821 |
| 2023 | $1,518 | $138,825 | $30,176 | $108,649 |
| 2022 | $1,489 | $136,104 | $29,585 | $106,519 |
| 2021 | $1,467 | $133,436 | $29,005 | $104,431 |
| 2020 | $1,443 | $132,069 | $28,708 | $103,361 |
| 2019 | $1,399 | $129,481 | $28,146 | $101,335 |
| 2018 | $1,366 | $126,944 | $27,595 | $99,349 |
| 2017 | $1,348 | $124,455 | $27,054 | $97,401 |
| 2016 | $1,313 | $122,016 | $26,524 | $95,492 |
| 2015 | $1,297 | $120,184 | $26,126 | $94,058 |
| 2014 | $1,267 | $117,831 | $25,615 | $92,216 |
Source: Public Records
Map
Nearby Homes
- 0 Salinas St Unit 225032962
- 10090 Arbolada Dr
- 00000 Arbolada Dr
- 0 Arbolada Dr Unit 224065324
- 0 Arbolada Dr Unit 41114682
- 0 Hoyito Cir
- 10502 Enramada Dr
- 13651 Barro Ct
- 13695 Barro Ct
- 4577 Madreselva St
- 14000 Cadena Way
- 5699 Arbolada Dr
- 10324 Gusanillo Way
- 5754 Lozano St
- 5887 Enramada Dr
- 3196 Granite Springs Rd
- 10470 Chicharra Ct
- 10427 Violeta Way
- 837 Castillo Way
- 3261 Granite Springs Rd
- 13470 Colina Way
- 13551 Salinas St
- 13535 Colina Way Unit 3T-1056
- 13535 Colina Way
- 0 3t1063 Colina Unit 13071791
- 3T-1063 Colina Way
- 13495 Colina Way
- 3T-1063 Colina Way Unit 3T-1063
- 13406 Salinas St
- 13443 Salinas St
- 13490 Salinas St
- 13551 Colina Way
- 13564 Colina Way
- 13548 Salinas St
- 13417 Salinas St
- 5060 Pozuelo Ct Unit 3T
- 5060 Pozuelo Ct
- 5060 Pozuelo Ct Unit 3T Lot 1088
- 13580 Colina Way
- 5069 Pozuelo Ct