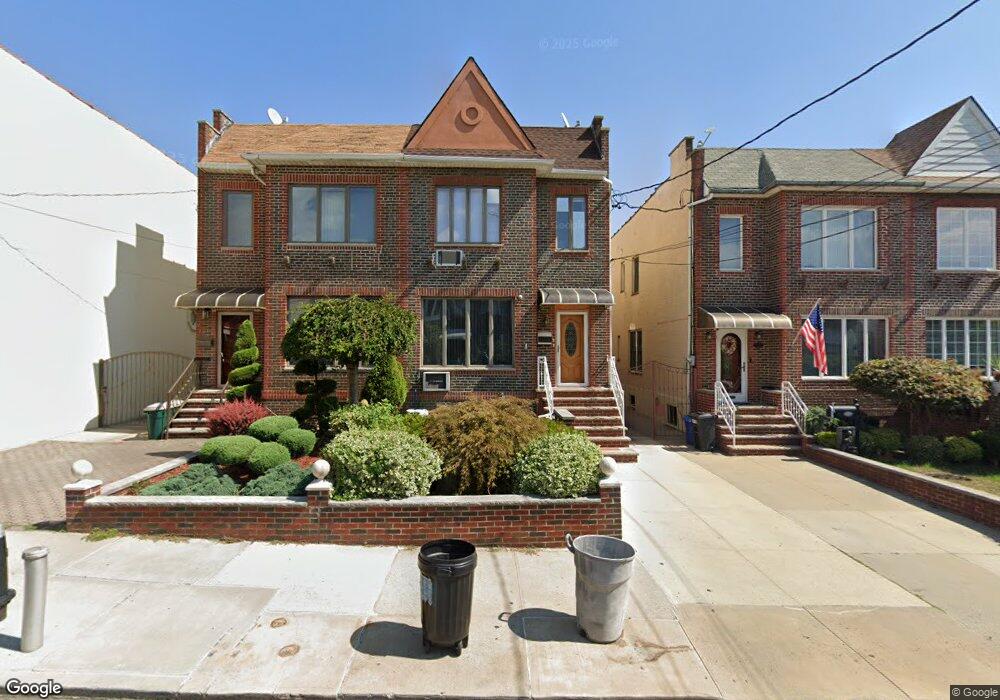
1349 80th St Unit 2nd FL Brooklyn, NY 11228
Dyker Heights NeighborhoodEstimated Value: $1,153,081 - $1,265,000
2
Beds
1
Bath
720
Sq Ft
$1,667/Sq Ft
Est. Value
About This Home
This home is located at 1349 80th St Unit 2nd FL, Brooklyn, NY 11228 and is currently estimated at $1,200,520, approximately $1,667 per square foot. 1349 80th St Unit 2nd FL is a home located in Kings County with nearby schools including P.S. 204 Vince Lombardi, IS 201 Madeleine Brennan Intermediate School, and New Utrecht High School.
Ownership History
Date
Name
Owned For
Owner Type
Purchase Details
Closed on
May 18, 2007
Sold by
Lanzarone Lita
Bought by
Cheng Johnny and Lau Xiao Ju
Current Estimated Value
Home Financials for this Owner
Home Financials are based on the most recent Mortgage that was taken out on this home.
Original Mortgage
$260,000
Outstanding Balance
$158,753
Interest Rate
6.24%
Mortgage Type
Purchase Money Mortgage
Estimated Equity
$1,041,767
Create a Home Valuation Report for This Property
The Home Valuation Report is an in-depth analysis detailing your home's value as well as a comparison with similar homes in the area
Home Values in the Area
Average Home Value in this Area
Purchase History
| Date | Buyer | Sale Price | Title Company |
|---|---|---|---|
| Cheng Johnny | $645,000 | -- | |
| Cheng Johnny | $645,000 | -- |
Source: Public Records
Mortgage History
| Date | Status | Borrower | Loan Amount |
|---|---|---|---|
| Open | Cheng Johnny | $260,000 | |
| Closed | Cheng Johnny | $260,000 |
Source: Public Records
Tax History Compared to Growth
Tax History
| Year | Tax Paid | Tax Assessment Tax Assessment Total Assessment is a certain percentage of the fair market value that is determined by local assessors to be the total taxable value of land and additions on the property. | Land | Improvement |
|---|---|---|---|---|
| 2025 | $8,527 | $56,520 | $20,280 | $36,240 |
| 2024 | $8,527 | $64,680 | $20,280 | $44,400 |
| 2023 | $8,186 | $63,900 | $20,280 | $43,620 |
| 2022 | $7,609 | $60,720 | $20,280 | $40,440 |
| 2021 | $7,576 | $59,940 | $20,280 | $39,660 |
| 2020 | $3,763 | $56,940 | $20,280 | $36,660 |
| 2019 | $7,352 | $56,940 | $20,280 | $36,660 |
| 2018 | $6,787 | $34,754 | $10,989 | $23,765 |
| 2017 | $6,420 | $32,962 | $11,581 | $21,381 |
| 2016 | $5,921 | $31,170 | $12,194 | $18,976 |
| 2015 | $3,531 | $31,150 | $14,529 | $16,621 |
| 2014 | $3,531 | $30,456 | $15,087 | $15,369 |
Source: Public Records
Map
Nearby Homes