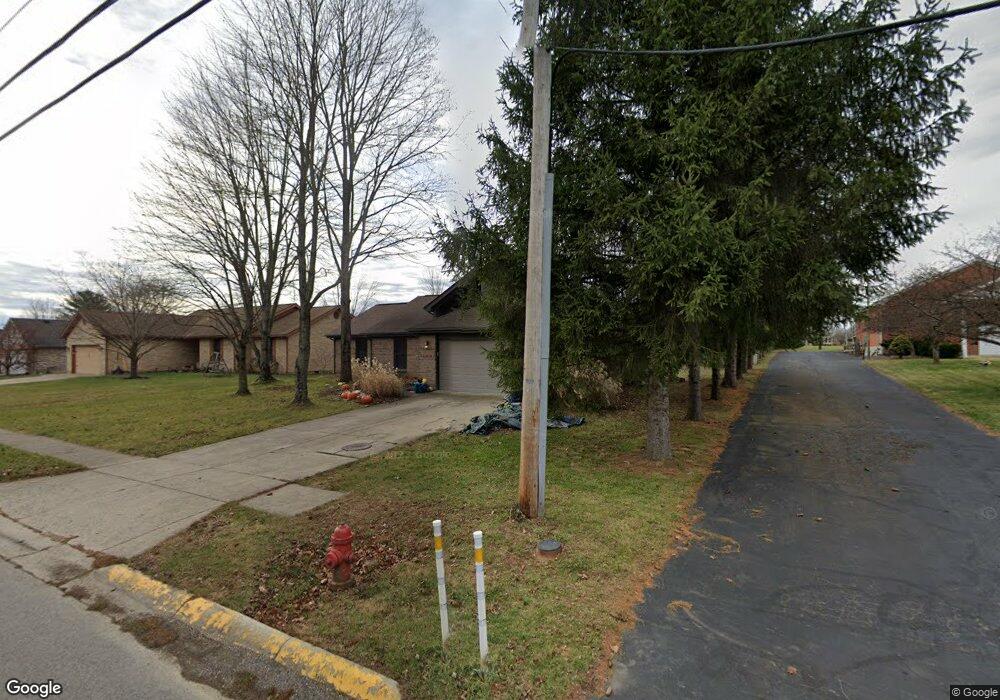
1349 Lytle Rd Waynesville, OH 45068
Wayne Township NeighborhoodEstimated Value: $303,577 - $342,000
3
Beds
3
Baths
1,645
Sq Ft
$201/Sq Ft
Est. Value
About This Home
This home is located at 1349 Lytle Rd, Waynesville, OH 45068 and is currently estimated at $330,144, approximately $200 per square foot. 1349 Lytle Rd is a home located in Warren County with nearby schools including Waynesville Elementary School, Waynesville Middle School, and Waynesville High School.
Ownership History
Date
Name
Owned For
Owner Type
Purchase Details
Closed on
Oct 26, 2012
Sold by
Jetter Heidi R and Jetter Joshua
Bought by
Jetter Heidi R
Current Estimated Value
Home Financials for this Owner
Home Financials are based on the most recent Mortgage that was taken out on this home.
Original Mortgage
$137,900
Outstanding Balance
$95,337
Interest Rate
3.4%
Mortgage Type
Future Advance Clause Open End Mortgage
Estimated Equity
$234,807
Purchase Details
Closed on
Jun 1, 2007
Sold by
Zimmerman William R
Bought by
Bone Heidi R
Home Financials for this Owner
Home Financials are based on the most recent Mortgage that was taken out on this home.
Original Mortgage
$145,000
Interest Rate
6.2%
Mortgage Type
Purchase Money Mortgage
Purchase Details
Closed on
Aug 4, 1992
Sold by
Peth Peth and Peth Nicholas A
Bought by
Zimmerman Zimmerman and Zimmerman William R
Purchase Details
Closed on
Jan 22, 1992
Sold by
Wright Wright and Wright Donald C
Bought by
Wright Wright and Wright Donald C
Create a Home Valuation Report for This Property
The Home Valuation Report is an in-depth analysis detailing your home's value as well as a comparison with similar homes in the area
Home Values in the Area
Average Home Value in this Area
Purchase History
| Date | Buyer | Sale Price | Title Company |
|---|---|---|---|
| Jetter Heidi R | -- | None Available | |
| Bone Heidi R | $155,000 | Landmark Title Agency South | |
| Zimmerman Zimmerman | $99,300 | -- | |
| Wright Wright | -- | -- |
Source: Public Records
Mortgage History
| Date | Status | Borrower | Loan Amount |
|---|---|---|---|
| Open | Jetter Heidi R | $137,900 | |
| Closed | Bone Heidi R | $145,000 |
Source: Public Records
Tax History Compared to Growth
Tax History
| Year | Tax Paid | Tax Assessment Tax Assessment Total Assessment is a certain percentage of the fair market value that is determined by local assessors to be the total taxable value of land and additions on the property. | Land | Improvement |
|---|---|---|---|---|
| 2024 | $3,922 | $89,700 | $24,500 | $65,200 |
| 2023 | $3,569 | $70,812 | $12,915 | $57,897 |
| 2022 | $3,499 | $70,812 | $12,915 | $57,897 |
| 2021 | $3,370 | $70,812 | $12,915 | $57,897 |
| 2020 | $3,191 | $57,572 | $10,500 | $47,072 |
| 2019 | $3,192 | $57,572 | $10,500 | $47,072 |
| 2018 | $3,193 | $57,572 | $10,500 | $47,072 |
| 2017 | $3,111 | $52,350 | $10,164 | $42,186 |
| 2016 | $2,924 | $52,350 | $10,164 | $42,186 |
| 2015 | $2,930 | $52,350 | $10,164 | $42,186 |
| 2014 | $2,768 | $46,740 | $9,080 | $37,670 |
| 2013 | $2,763 | $54,070 | $10,500 | $43,570 |
Source: Public Records
Map
Nearby Homes
- 1198 Lytle Rd
- 1106 Lytle Rd
- 1036 Bayberry Dr
- 1106 Brookfield Dr Unit 1106
- 60 E Ellis Dr
- 363 Victoria Place
- 350 Somerset Ln
- 460 Miami St
- 53 S 4th St
- 437 N Main St
- 7219 N Route 42
- 1 Cumberland Ct
- 196 S 3rd St
- 7219 U S 42
- 155 S Main St
- 7219 N Us Rt 42
- 0 Ohio 73 Unit 944080
- 401 Wilkerson Ln
- 8519 Old Stage Rd
- 127 New Burlington Rd
- 1327 Lytle Rd
- 1315 Lytle Rd
- 1276 Anthony Trace
- 1292 Anthony Trace
- Lot #12 Lytle Rd
- Lot #11 Lytle Rd
- 1273 Lytle Rd
- 1254 Anthony Trace
- 1287 Anthony Trace
- 1390 Lytle Rd
- 1261 Lytle Rd
- 946 Preston Dr
- 1232 Anthony Trace
- 1350 Lytle Rd
- 924 Preston Dr
- 830 Camp Creek Rd
- 1253 Lytle Rd
- 1269 Anthony Trace
- 1251 Anthony Trace
- 862 Camp Creek Rd