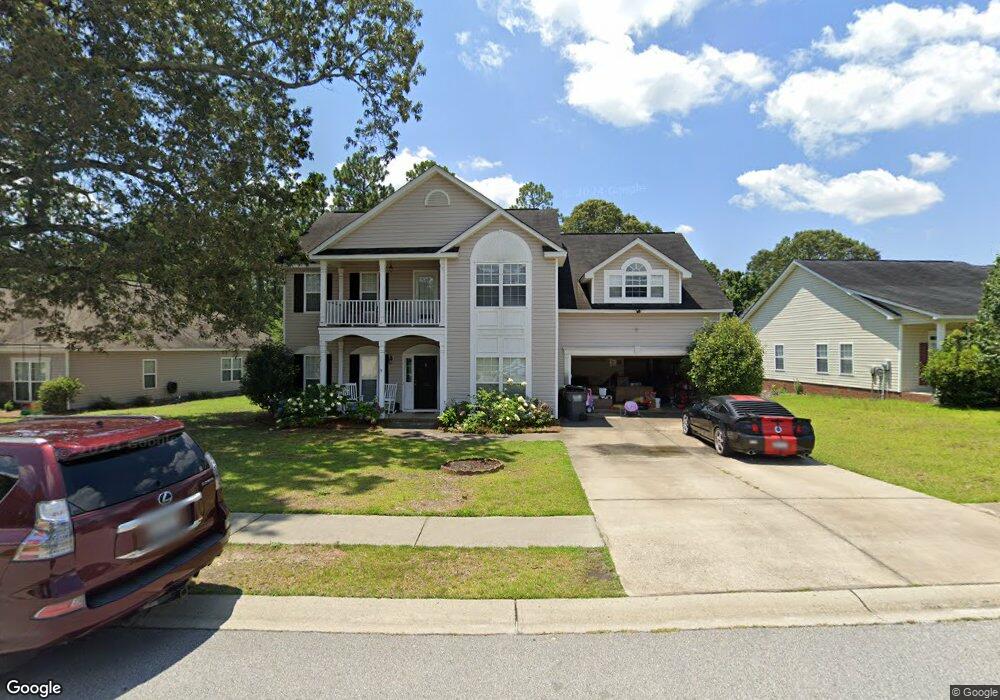
135 Baneberry Dr Unit 67 Lexington, SC 29073
Estimated Value: $318,000 - $331,170
4
Beds
3
Baths
2,860
Sq Ft
$113/Sq Ft
Est. Value
About This Home
This home is located at 135 Baneberry Dr Unit 67, Lexington, SC 29073 and is currently estimated at $322,293, approximately $112 per square foot. 135 Baneberry Dr Unit 67 is a home located in Lexington County with nearby schools including Deerfield Elementary School, Carolina Springs Middle School, and White Knoll High School.
Ownership History
Date
Name
Owned For
Owner Type
Purchase Details
Closed on
Feb 27, 2020
Sold by
Jpmorgan Chase Bank National Association
Bought by
Coffey Sean Patrick and Coffey Nichole Prestigiacomo
Current Estimated Value
Home Financials for this Owner
Home Financials are based on the most recent Mortgage that was taken out on this home.
Original Mortgage
$191,919
Outstanding Balance
$170,293
Interest Rate
3.6%
Mortgage Type
New Conventional
Estimated Equity
$152,000
Purchase Details
Closed on
Oct 30, 2019
Sold by
Sloan Daniel R
Bought by
Jpmorgan Chase Bank
Purchase Details
Closed on
Feb 26, 2010
Sold by
Shumaker Homes Inc
Bought by
Sloan Daniel R
Home Financials for this Owner
Home Financials are based on the most recent Mortgage that was taken out on this home.
Original Mortgage
$214,275
Interest Rate
5%
Mortgage Type
Future Advance Clause Open End Mortgage
Create a Home Valuation Report for This Property
The Home Valuation Report is an in-depth analysis detailing your home's value as well as a comparison with similar homes in the area
Home Values in the Area
Average Home Value in this Area
Purchase History
| Date | Buyer | Sale Price | Title Company |
|---|---|---|---|
| Coffey Sean Patrick | $190,000 | None Available | |
| Jpmorgan Chase Bank | $214,275 | None Available | |
| Sloan Daniel R | $209,990 | -- |
Source: Public Records
Mortgage History
| Date | Status | Borrower | Loan Amount |
|---|---|---|---|
| Open | Coffey Sean Patrick | $191,919 | |
| Previous Owner | Sloan Daniel R | $214,275 |
Source: Public Records
Tax History Compared to Growth
Tax History
| Year | Tax Paid | Tax Assessment Tax Assessment Total Assessment is a certain percentage of the fair market value that is determined by local assessors to be the total taxable value of land and additions on the property. | Land | Improvement |
|---|---|---|---|---|
| 2024 | $1,290 | $8,640 | $1,200 | $7,440 |
| 2023 | $1,290 | $8,640 | $1,200 | $7,440 |
| 2020 | $1,319 | $8,640 | $1,200 | $7,440 |
| 2019 | $1,275 | $8,197 | $1,200 | $6,997 |
| 2018 | $1,251 | $8,197 | $1,200 | $6,997 |
| 2017 | $1,214 | $8,197 | $1,200 | $6,997 |
| 2016 | $1,203 | $8,196 | $1,200 | $6,996 |
| 2014 | $1,178 | $8,399 | $1,200 | $7,199 |
| 2013 | -- | $8,400 | $1,200 | $7,200 |
Source: Public Records
Map
Nearby Homes
- 103 Stanley Ct
- 0 Longs Pond Rd Unit 603436
- 1069 Roscoe Rd
- 224 Heathrow Way
- 439 Dorney Rd
- 146 Whitton Ct
- 112 Maple Ridge Ct
- 140 Whitton Ct
- 141 White Cedar Way
- 2628 Moon Seed Ct
- 3003 Snail Seed Trail
- 3014 Snail Seed Trail
- 2616 Moon Seed Ct
- 2621 Moon Seed Ct
- 2637 Moon Seed Ct
- 2613 Moon Seed Ct
- 2641 Moon Seed Ct
- 3054 Snail Seed Trail
- 128 Whitton Ct
- 238 Starling Way
- 135 Baneberry Dr
- 131 Baneberry Dr
- 139 Baneberry Dr
- 228 Baneberry Loop
- 127 Baneberry Dr
- 136 Baneberry Dr
- 242 Baneberry Loop
- 132 Baneberry Dr
- 224 Baneberry Loop
- 128 Baneberry Dr
- 123 Baneberry Dr
- 123 Baneberry Dr Unit 70
- 235 Baneberry Loop
- 231 Baneberry Loop
- 124 Baneberry Dr
- 246 Baneberry Loop
- 239 Baneberry Loop
- 227 Baneberry Loop
- 220 Baneberry Loop
- 119 Baneberry Dr