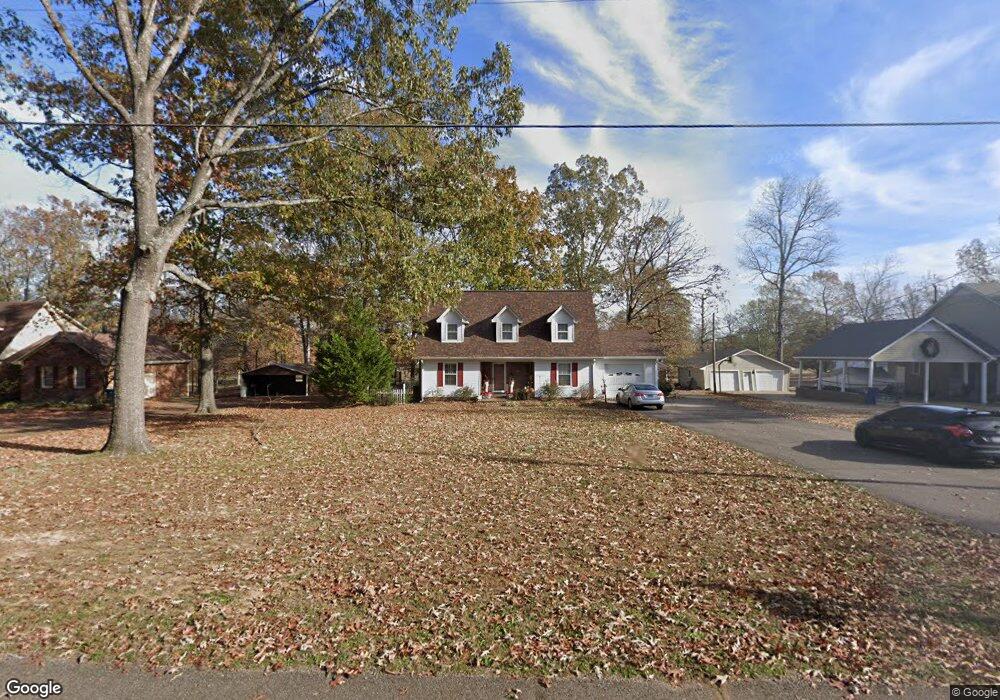
135 Cagle Cir Savannah, TN 38372
Estimated Value: $225,000 - $322,000
Studio
2
Baths
1,588
Sq Ft
$160/Sq Ft
Est. Value
About This Home
This home is located at 135 Cagle Cir, Savannah, TN 38372 and is currently estimated at $254,275, approximately $160 per square foot. 135 Cagle Cir is a home located in Hardin County with nearby schools including Hardin County High School, Hardin County Christian School, and Savannah Christian Academy.
Ownership History
Date
Name
Owned For
Owner Type
Purchase Details
Closed on
Jun 28, 2008
Sold by
Wilkerson Jimmy G
Bought by
Wilkerson Deanna M
Current Estimated Value
Purchase Details
Closed on
May 25, 2007
Sold by
King Roy O
Bought by
Wilkerson Jimmy G
Home Financials for this Owner
Home Financials are based on the most recent Mortgage that was taken out on this home.
Original Mortgage
$138,500
Interest Rate
6.16%
Purchase Details
Closed on
May 11, 2007
Sold by
King Penne L
Bought by
King Roy O
Home Financials for this Owner
Home Financials are based on the most recent Mortgage that was taken out on this home.
Original Mortgage
$138,500
Interest Rate
6.16%
Purchase Details
Closed on
Jul 21, 2005
Sold by
King Roy O
Bought by
King Penne L
Purchase Details
Closed on
Dec 2, 2004
Sold by
Williams Daniel Robt
Bought by
King Roy O
Purchase Details
Closed on
Jun 18, 1985
Bought by
Williams Daniel Robt and Williams Gloria B
Create a Home Valuation Report for This Property
The Home Valuation Report is an in-depth analysis detailing your home's value as well as a comparison with similar homes in the area
Home Values in the Area
Average Home Value in this Area
Purchase History
| Date | Buyer | Sale Price | Title Company |
|---|---|---|---|
| Wilkerson Deanna M | -- | -- | |
| Wilkerson Jimmy G | $137,000 | -- | |
| King Roy O | -- | -- | |
| King Penne L | -- | -- | |
| King Roy O | $111,000 | -- | |
| Williams Daniel Robt | -- | -- |
Source: Public Records
Mortgage History
| Date | Status | Borrower | Loan Amount |
|---|---|---|---|
| Previous Owner | Williams Daniel Robt | $138,500 |
Source: Public Records
Tax History
| Year | Tax Paid | Tax Assessment Tax Assessment Total Assessment is a certain percentage of the fair market value that is determined by local assessors to be the total taxable value of land and additions on the property. | Land | Improvement |
|---|---|---|---|---|
| 2025 | $1,137 | $46,425 | $6,250 | $40,175 |
| 2024 | $1,137 | $46,425 | $6,250 | $40,175 |
| 2023 | $1,137 | $46,425 | $6,250 | $40,175 |
| 2022 | $750 | $27,175 | $3,925 | $23,250 |
| 2021 | $750 | $27,175 | $3,925 | $23,250 |
| 2020 | $750 | $27,175 | $3,925 | $23,250 |
| 2019 | $750 | $27,175 | $3,925 | $23,250 |
| 2018 | $731 | $27,175 | $3,925 | $23,250 |
| 2017 | $760 | $27,350 | $3,225 | $24,125 |
| 2016 | $760 | $27,350 | $3,225 | $24,125 |
| 2015 | $689 | $27,350 | $3,225 | $24,125 |
| 2014 | $689 | $27,350 | $3,225 | $24,125 |
Source: Public Records
Map
Nearby Homes
- 00 E End Dr
- 15 Bluebell Cove
- 190 Chariot Ln
- 165 Phillips Dr
- 30 Blount Dr
- 200 Hardin Rd
- 100 Union Camp Dr
- 15 Bayberry Cove
- 85 Hac St
- 690 Patterson Rd
- 680 Patterson Rd
- 615 Patterson Rd
- 635 Patterson Rd
- 105 Hays St
- 165 Foursquare St
- 110 Rb Dr
- 115 Rb Dr
- 347 Rosewood Dr
- 13305 U S Highway 64
- 00 Enoch Blvd
Your Personal Tour Guide
Ask me questions while you tour the home.