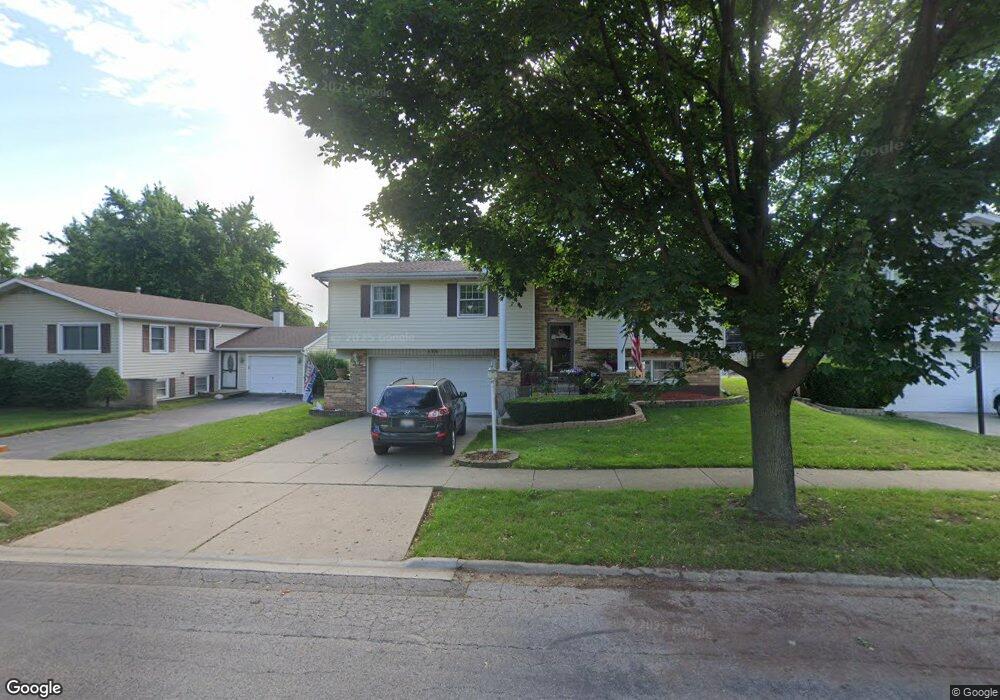
135 Chestnut Ln Wheeling, IL 60090
Estimated Value: $403,741 - $446,000
4
Beds
4
Baths
1,406
Sq Ft
$303/Sq Ft
Est. Value
About This Home
This home is located at 135 Chestnut Ln, Wheeling, IL 60090 and is currently estimated at $425,435, approximately $302 per square foot. 135 Chestnut Ln is a home located in Cook County with nearby schools including Eugene Field Elementary School, Jack London Middle School, and Buffalo Grove High School.
Ownership History
Date
Name
Owned For
Owner Type
Purchase Details
Closed on
Mar 4, 2003
Sold by
Albany Bank & Trust Co Na
Bought by
Kozakowski Agnes
Current Estimated Value
Purchase Details
Closed on
Feb 28, 1997
Sold by
Gros Louis Amy and Lembessis Peter
Bought by
Lembessis Peter
Home Financials for this Owner
Home Financials are based on the most recent Mortgage that was taken out on this home.
Original Mortgage
$181,900
Interest Rate
11.12%
Purchase Details
Closed on
Nov 30, 1995
Sold by
Gros Louis Amy
Bought by
Gros Louis Amy and Lembessis Peter
Purchase Details
Closed on
May 18, 1995
Sold by
Harris Bank Roselle
Bought by
Gros Louis Amy C
Home Financials for this Owner
Home Financials are based on the most recent Mortgage that was taken out on this home.
Original Mortgage
$147,200
Interest Rate
8.26%
Create a Home Valuation Report for This Property
The Home Valuation Report is an in-depth analysis detailing your home's value as well as a comparison with similar homes in the area
Home Values in the Area
Average Home Value in this Area
Purchase History
| Date | Buyer | Sale Price | Title Company |
|---|---|---|---|
| Kozakowski Agnes | -- | -- | |
| Kozakowski Agnes | -- | -- | |
| Lembessis Peter | -- | Lawyers Title Insurance Corp | |
| Gros Louis Amy | -- | -- | |
| Gros Louis Amy C | $184,000 | -- |
Source: Public Records
Mortgage History
| Date | Status | Borrower | Loan Amount |
|---|---|---|---|
| Previous Owner | Lembessis Peter | $181,900 | |
| Previous Owner | Gros Louis Amy C | $147,200 |
Source: Public Records
Tax History
| Year | Tax Paid | Tax Assessment Tax Assessment Total Assessment is a certain percentage of the fair market value that is determined by local assessors to be the total taxable value of land and additions on the property. | Land | Improvement |
|---|---|---|---|---|
| 2025 | $8,608 | $36,000 | $6,480 | $29,520 |
| 2024 | $8,608 | $29,000 | $5,400 | $23,600 |
| 2023 | $8,176 | $29,000 | $5,400 | $23,600 |
| 2022 | $8,176 | $29,000 | $5,400 | $23,600 |
| 2021 | $5,749 | $18,847 | $4,140 | $14,707 |
| 2020 | $5,682 | $18,847 | $4,140 | $14,707 |
| 2019 | $5,784 | $21,082 | $4,140 | $16,942 |
| 2018 | $7,610 | $24,287 | $3,600 | $20,687 |
| 2017 | $7,476 | $24,287 | $3,600 | $20,687 |
| 2016 | $7,270 | $24,287 | $3,600 | $20,687 |
| 2015 | $7,426 | $23,463 | $3,060 | $20,403 |
| 2014 | $7,263 | $23,463 | $3,060 | $20,403 |
| 2013 | $6,686 | $23,463 | $3,060 | $20,403 |
Source: Public Records
Map
Nearby Homes
- 640 Mchenry Rd Unit 301
- 842 Colonial Dr Unit B
- 1052 Southbury Ln Unit 1
- 1410 Tulip Ct Unit D2
- 822 Colonial Dr Unit B
- 813 Valley Stream Dr Unit D
- 350 E Dundee Rd Unit 207B
- 550 Greystone Ln Unit A2
- 586 Fairway View Dr Unit 2C
- 575 Greystone Ln Unit A2
- 1157 Middlebury Ln Unit 1
- 1321 Marcy Ln
- 588 Fairway View Dr Unit 2E
- 88 W Wayne Place
- 1600 Brittany Ct Unit C-2
- 175 Lake Blvd Unit 349
- 175 Lake Blvd Unit 345
- 150 Lake Blvd Unit 120
- 1324 Alpine Ct Unit 104
- 50 Lake Blvd Unit 632
- 139 Chestnut Ln
- 131 Chestnut Ln
- 123 Chestnut Ln
- 143 Chestnut Ln
- 124 Saint Armand Ln
- 128 Saint Armand Ln
- 120 Saint Armand Ln
- 128 St Armand Ln
- 116 Saint Armand Ln
- 149 Chestnut Ln
- 119 Chestnut Ln
- 136 Chestnut Ln
- 140 Chestnut Ln Unit 5
- 132 Chestnut Ln
- 144 Chestnut Ln
- 132 Saint Armand Ln
- 112 Saint Armand Ln
- 124 Chestnut Ln Unit 5
- 148 Chestnut Ln
- 115 Chestnut Ln
Your Personal Tour Guide
Ask me questions while you tour the home.