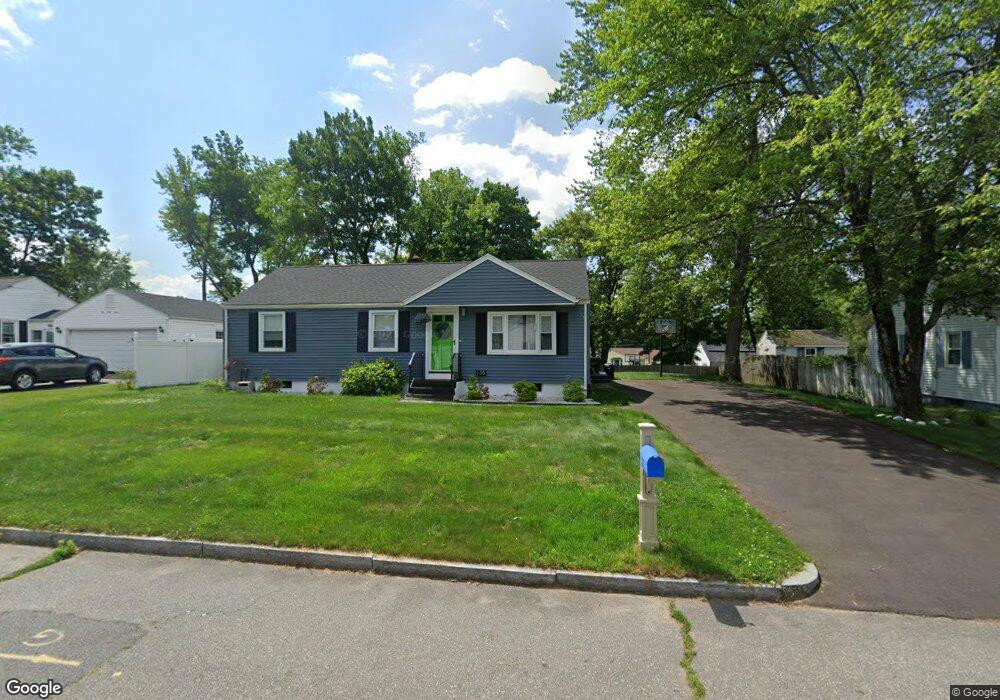
135 Cheyenne Rd Springfield, MA 01109
Sixteen Acres NeighborhoodEstimated Value: $291,000 - $317,000
3
Beds
2
Baths
1,445
Sq Ft
$209/Sq Ft
Est. Value
About This Home
This home is located at 135 Cheyenne Rd, Springfield, MA 01109 and is currently estimated at $302,020, approximately $209 per square foot. 135 Cheyenne Rd is a home located in Hampden County with nearby schools including Frank H. Freedman School, John J Duggan Middle, and Springfield High School of Science and Technology.
Ownership History
Date
Name
Owned For
Owner Type
Purchase Details
Closed on
Feb 10, 2025
Sold by
Underwood Leonard W
Bought by
Fredericks Linda and Underwood Leonard W
Current Estimated Value
Purchase Details
Closed on
May 28, 2024
Sold by
Fredericks Linda
Bought by
Underwood Leonard W
Purchase Details
Closed on
Jul 23, 2007
Sold by
Underwood Linda M and Fredericks Linda
Bought by
Fredericks Linda and Fredericks Richard
Home Financials for this Owner
Home Financials are based on the most recent Mortgage that was taken out on this home.
Original Mortgage
$60,000
Interest Rate
6.54%
Mortgage Type
Purchase Money Mortgage
Purchase Details
Closed on
Jul 25, 1984
Bought by
Fredericks Linda and Fredericks Richard
Create a Home Valuation Report for This Property
The Home Valuation Report is an in-depth analysis detailing your home's value as well as a comparison with similar homes in the area
Home Values in the Area
Average Home Value in this Area
Purchase History
| Date | Buyer | Sale Price | Title Company |
|---|---|---|---|
| Fredericks Linda | -- | None Available | |
| Fredericks Linda | -- | None Available | |
| Underwood Leonard W | -- | None Available | |
| Underwood Leonard W | -- | None Available | |
| Underwood Leonard W | -- | None Available | |
| Fredericks Linda | -- | -- | |
| Fredericks Linda | -- | -- | |
| Fredericks Linda | $44,000 | -- | |
| Fredericks Linda | -- | -- |
Source: Public Records
Mortgage History
| Date | Status | Borrower | Loan Amount |
|---|---|---|---|
| Previous Owner | Fredericks Linda | $60,000 |
Source: Public Records
Tax History
| Year | Tax Paid | Tax Assessment Tax Assessment Total Assessment is a certain percentage of the fair market value that is determined by local assessors to be the total taxable value of land and additions on the property. | Land | Improvement |
|---|---|---|---|---|
| 2025 | $3,724 | $237,500 | $51,700 | $185,800 |
| 2024 | $3,822 | $238,000 | $51,700 | $186,300 |
| 2023 | $3,904 | $229,000 | $49,200 | $179,800 |
| 2022 | $3,213 | $170,700 | $49,200 | $121,500 |
| 2021 | $3,130 | $165,600 | $44,700 | $120,900 |
| 2020 | $3,066 | $157,000 | $44,700 | $112,300 |
| 2019 | $2,893 | $147,000 | $44,700 | $102,300 |
| 2018 | $2,848 | $144,700 | $44,700 | $100,000 |
| 2017 | $2,862 | $145,600 | $49,600 | $96,000 |
| 2016 | $2,768 | $140,800 | $49,600 | $91,200 |
| 2015 | $2,593 | $131,800 | $49,600 | $82,200 |
Source: Public Records
Map
Nearby Homes
- 744 Bradley Rd
- 30 W Hill Rd
- 55 Old Farm Rd
- 74 Valley Rd
- 73 Timber Ln
- 647 Plumtree Rd
- 37 Chesterfield Ave
- 54 S Shore Dr
- 384 Abbott St
- 944 Wilbraham Rd
- 509 Plumtree Rd
- 63 Lawton St
- 101 Regal St
- 75 Gillette Cir
- 750 Wilbraham Rd
- 18 Riverton Rd
- 120 Bridle Path Rd
- 236 Pondview Dr
- 8 Putnam St
- 108 Birchland Ave
Your Personal Tour Guide
Ask me questions while you tour the home.