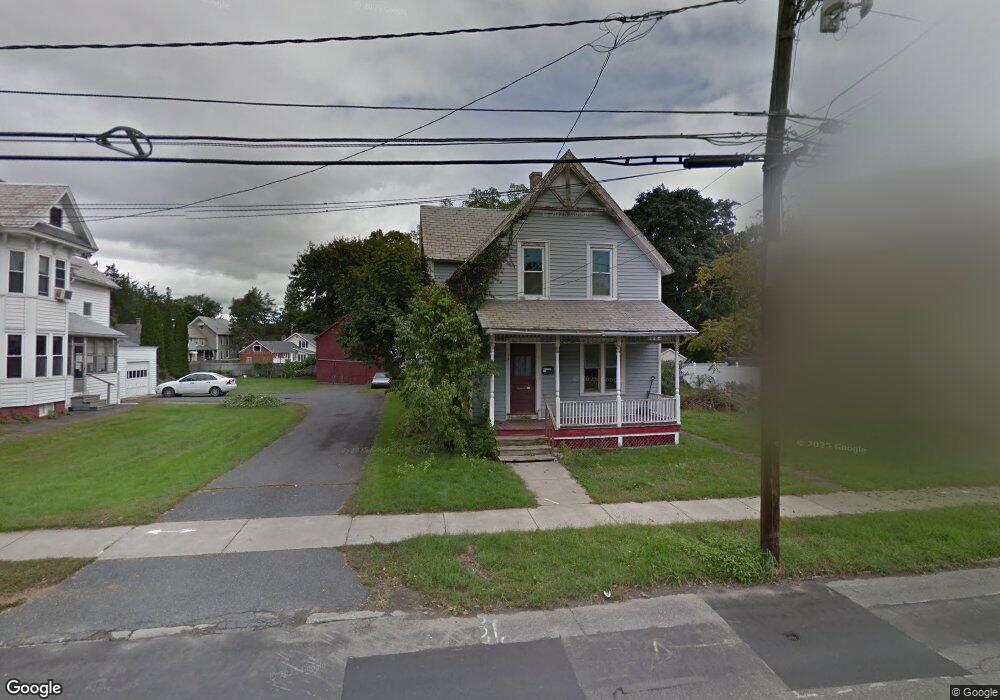
135 Conway St Greenfield, MA 01301
Estimated Value: $268,000 - $330,452
5
Beds
2
Baths
2,580
Sq Ft
$118/Sq Ft
Est. Value
About This Home
This home is located at 135 Conway St, Greenfield, MA 01301 and is currently estimated at $303,613, approximately $117 per square foot. 135 Conway St is a home located in Franklin County with nearby schools including Four Rivers Charter Public School, Cornerstone Christian School, and Holy Trinity School.
Ownership History
Date
Name
Owned For
Owner Type
Purchase Details
Closed on
Aug 26, 2025
Sold by
Simon Philip A and Simon Angella L
Bought by
Plus One Properties Llc
Current Estimated Value
Home Financials for this Owner
Home Financials are based on the most recent Mortgage that was taken out on this home.
Original Mortgage
$150,000
Outstanding Balance
$149,608
Interest Rate
6.72%
Mortgage Type
Commercial
Estimated Equity
$154,005
Purchase Details
Closed on
Sep 15, 2004
Sold by
Sabey Jeffrey P
Bought by
Simon Angella L and Simon Philip A
Home Financials for this Owner
Home Financials are based on the most recent Mortgage that was taken out on this home.
Original Mortgage
$133,100
Interest Rate
6.02%
Mortgage Type
Purchase Money Mortgage
Purchase Details
Closed on
May 18, 1990
Sold by
Theresa Jones Keyes
Bought by
Sabey Jeffrey P
Purchase Details
Closed on
Jul 14, 1989
Sold by
Colbeth Raymond L
Bought by
Sabey Jeffrey P
Create a Home Valuation Report for This Property
The Home Valuation Report is an in-depth analysis detailing your home's value as well as a comparison with similar homes in the area
Home Values in the Area
Average Home Value in this Area
Purchase History
| Date | Buyer | Sale Price | Title Company |
|---|---|---|---|
| Plus One Properties Llc | -- | -- | |
| Plus One Properties Llc | -- | -- | |
| Simon Angella L | $147,900 | -- | |
| Simon Angella L | $147,900 | -- | |
| Sabey Jeffrey P | $1,000 | -- | |
| Sabey Jeffrey P | $1,000 | -- | |
| Sabey Jeffrey P | $129,000 | -- | |
| Sabey Jeffrey P | $129,000 | -- |
Source: Public Records
Mortgage History
| Date | Status | Borrower | Loan Amount |
|---|---|---|---|
| Open | Plus One Properties Llc | $150,000 | |
| Closed | Plus One Properties Llc | $150,000 | |
| Previous Owner | Sabey Jeffrey P | $121,500 | |
| Previous Owner | Sabey Jeffrey P | $133,100 |
Source: Public Records
Tax History Compared to Growth
Tax History
| Year | Tax Paid | Tax Assessment Tax Assessment Total Assessment is a certain percentage of the fair market value that is determined by local assessors to be the total taxable value of land and additions on the property. | Land | Improvement |
|---|---|---|---|---|
| 2025 | $4,960 | $253,600 | $47,100 | $206,500 |
| 2024 | $5,053 | $247,800 | $43,000 | $204,800 |
| 2023 | $4,354 | $221,600 | $43,000 | $178,600 |
| 2022 | $4,234 | $189,700 | $40,900 | $148,800 |
| 2021 | $4,108 | $176,900 | $44,000 | $132,900 |
| 2020 | $3,962 | $172,800 | $39,900 | $132,900 |
| 2019 | $3,750 | $167,700 | $34,800 | $132,900 |
| 2018 | $3,674 | $163,800 | $34,100 | $129,700 |
| 2017 | $3,559 | $163,800 | $34,100 | $129,700 |
| 2016 | $3,503 | $160,600 | $29,700 | $130,900 |
| 2015 | $3,415 | $151,700 | $30,000 | $121,700 |
| 2014 | $3,116 | $151,800 | $30,000 | $121,800 |
Source: Public Records
Map
Nearby Homes
- 139 Conway St
- 131 Conway St
- 141 Conway St
- 127 Conway St
- 142 Wells St
- 143 Conway St
- 140 Wells St
- 136 Conway St
- 146 Wells St
- 145 Conway St
- 134 Wells St
- 121 Conway St Unit 123
- 132 Wells St
- 128 Conway St
- 122 Conway St
- 144 Conway St
- 147 Conway St
- 124 Conway St
- 124 Conway St Unit Second Floor Apt 2
- 117 Conway St Unit 119