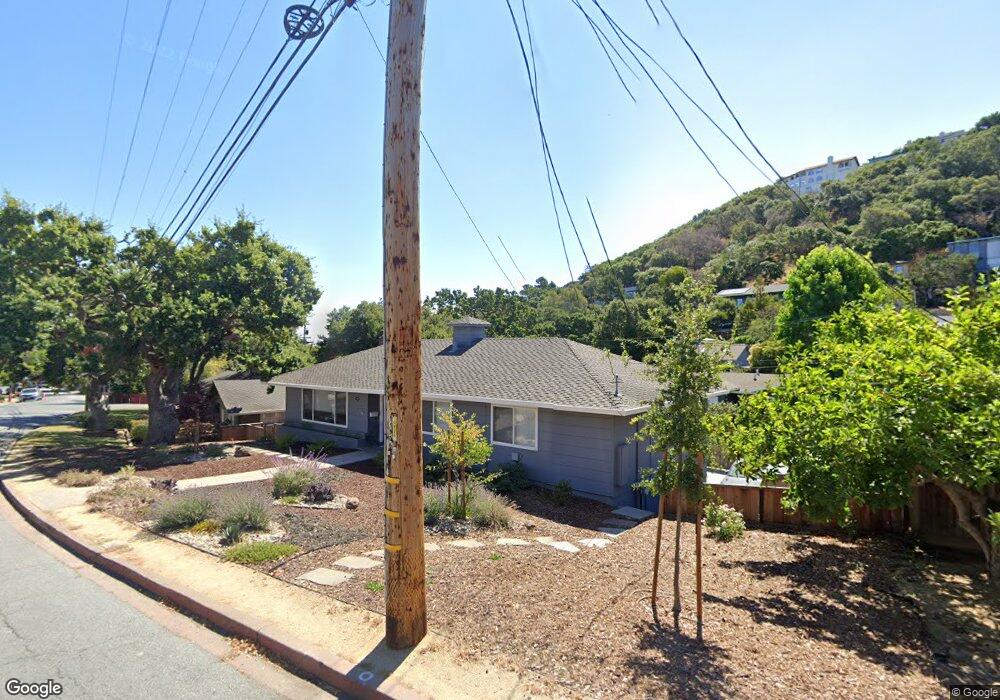
135 Devonshire Blvd San Carlos, CA 94070
Beverly Terrace NeighborhoodEstimated Value: $2,463,000 - $2,853,000
4
Beds
3
Baths
2,100
Sq Ft
$1,288/Sq Ft
Est. Value
About This Home
This home is located at 135 Devonshire Blvd, San Carlos, CA 94070 and is currently estimated at $2,704,998, approximately $1,288 per square foot. 135 Devonshire Blvd is a home located in San Mateo County with nearby schools including Arundel Elementary School, Tierra Linda Middle School, and Carlmont High School.
Ownership History
Date
Name
Owned For
Owner Type
Purchase Details
Closed on
Apr 16, 2012
Sold by
Chang Nat C and Chang Cynthia L
Bought by
Chang Nat Chun Nan and Chang Cynthia Loesch
Current Estimated Value
Purchase Details
Closed on
Oct 23, 1996
Sold by
Palermo Christopher J and Mccall Colleen J
Bought by
Chang Nat C and Chang Cynthia L
Home Financials for this Owner
Home Financials are based on the most recent Mortgage that was taken out on this home.
Original Mortgage
$280,000
Outstanding Balance
$25,754
Interest Rate
8.11%
Estimated Equity
$2,679,244
Purchase Details
Closed on
Feb 28, 1994
Sold by
California Federal Bank
Bought by
Palermo Christopher J and Mccall Colleen J
Home Financials for this Owner
Home Financials are based on the most recent Mortgage that was taken out on this home.
Original Mortgage
$324,000
Interest Rate
4%
Create a Home Valuation Report for This Property
The Home Valuation Report is an in-depth analysis detailing your home's value as well as a comparison with similar homes in the area
Home Values in the Area
Average Home Value in this Area
Purchase History
We collect this data history from publicly available records. To have your information removed, we recommend requesting removal directly through your county’s website.
| Date | Buyer | Sale Price | Title Company |
|---|---|---|---|
| Chang Nat Chun Nan | -- | None Available | |
| Chang Nat C | $430,000 | North American Title Co | |
| Palermo Christopher J | $360,000 | Fidelity National Title Ins |
Source: Public Records
Mortgage History
We collect this data history from publicly available records. To have your information removed, we recommend requesting removal directly through your county’s website.
| Date | Status | Borrower | Loan Amount |
|---|---|---|---|
| Open | Chang Nat C | $280,000 | |
| Previous Owner | Palermo Christopher J | $324,000 |
Source: Public Records
Tax History
| Year | Tax Paid | Tax Assessment Tax Assessment Total Assessment is a certain percentage of the fair market value that is determined by local assessors to be the total taxable value of land and additions on the property. | Land | Improvement |
|---|---|---|---|---|
| 2025 | $9,268 | $708,665 | $350,156 | $358,509 |
| 2023 | $9,268 | $681,150 | $336,560 | $344,590 |
| 2022 | $8,726 | $667,795 | $329,961 | $337,834 |
| 2021 | $8,583 | $654,703 | $323,492 | $331,211 |
| 2020 | $8,469 | $647,990 | $320,175 | $327,815 |
| 2019 | $8,602 | $635,287 | $313,898 | $321,389 |
| 2018 | $8,370 | $622,833 | $307,744 | $315,089 |
| 2017 | $8,246 | $610,621 | $301,710 | $308,911 |
| 2016 | $8,058 | $598,650 | $295,795 | $302,855 |
| 2015 | $8,031 | $589,658 | $291,352 | $298,306 |
| 2014 | $7,752 | $578,108 | $285,645 | $292,463 |
Source: Public Records
Map
Nearby Homes
- 0 Devonshire Blvd
- 162 Coronado Ave
- 76 Fay Ave
- 32 Beverly Dr
- 110 Dolton Ave
- 135 Dolton Ave
- 65 Madera Ave
- 146 Palm Ave
- 39 Madera Ave
- 222 Oakley Ave
- 145 Vista Del Grande None
- 339 Chesham Ave
- 15 Bay View Dr
- 3 Garden Ln
- 2755 San Carlos Ave
- 416 Portofino Dr Unit 206
- 2404 Melendy Dr
- 124 Vine St
- 273 Cedar St
- 663 Prospect St
- 139 Devonshire Blvd
- 127 Devonshire Blvd
- 19 Willow Glen Way
- 11 Willow Glen Way
- 23 Willow Glen Way
- 136 Devonshire Blvd
- 12 Willow Glen Way
- 132 Devonshire Blvd
- 140 Devonshire Blvd
- 27 Willow Glen Way
- 28 Fay Ave
- 32 Fay Ave
- 124 Devonshire Blvd
- 144 Devonshire Blvd
- 16 Fay Ave
- 36 Fay Ave
- 31 Willow Glen Way
- 2294 Carmelita Dr
- 149 Devonshire Blvd
- 120 Devonshire Blvd
Your Personal Tour Guide
Ask me questions while you tour the home.