Estimated Value: $278,303 - $356,000
3
Beds
2
Baths
1,912
Sq Ft
$164/Sq Ft
Est. Value
About This Home
This home is located at 135 Dinkins Ln, Cairo, GA 39827 and is currently estimated at $312,768, approximately $163 per square foot. 135 Dinkins Ln is a home located in Grady County.
Ownership History
Date
Name
Owned For
Owner Type
Purchase Details
Closed on
Sep 7, 2006
Sold by
Roy Gary Albert
Bought by
Holloway Christi L and Roy Gary Albert
Current Estimated Value
Home Financials for this Owner
Home Financials are based on the most recent Mortgage that was taken out on this home.
Original Mortgage
$41,000
Outstanding Balance
$23,778
Interest Rate
6.52%
Mortgage Type
New Conventional
Estimated Equity
$288,990
Purchase Details
Closed on
Jan 6, 1999
Sold by
Dinkins Kerry
Bought by
Roy Gary Albert
Purchase Details
Closed on
Aug 22, 1996
Sold by
Dinkins J Gerald
Bought by
Dinkins Kerry
Purchase Details
Closed on
Feb 1, 1989
Bought by
Dinkins J Gerald
Create a Home Valuation Report for This Property
The Home Valuation Report is an in-depth analysis detailing your home's value as well as a comparison with similar homes in the area
Purchase History
| Date | Buyer | Sale Price | Title Company |
|---|---|---|---|
| Holloway Christi L | -- | -- | |
| Roy Gary Albert | $89,500 | -- | |
| Dinkins Kerry | -- | -- | |
| Dinkins J Gerald | $2,500 | -- |
Source: Public Records
Mortgage History
| Date | Status | Borrower | Loan Amount |
|---|---|---|---|
| Open | Holloway Christi L | $41,000 |
Source: Public Records
Tax History
| Year | Tax Paid | Tax Assessment Tax Assessment Total Assessment is a certain percentage of the fair market value that is determined by local assessors to be the total taxable value of land and additions on the property. | Land | Improvement |
|---|---|---|---|---|
| 2025 | $2,218 | $106,753 | $20,576 | $86,177 |
| 2024 | $2,218 | $87,616 | $20,576 | $67,040 |
| 2023 | $1,486 | $48,270 | $12,822 | $35,448 |
| 2022 | $1,486 | $48,270 | $12,822 | $35,448 |
| 2021 | $1,491 | $48,270 | $12,822 | $35,448 |
| 2020 | $1,496 | $48,270 | $12,822 | $35,448 |
| 2019 | $1,496 | $48,270 | $12,822 | $35,448 |
| 2018 | $1,404 | $48,270 | $12,822 | $35,448 |
| 2017 | $1,337 | $48,270 | $12,822 | $35,448 |
| 2016 | $1,180 | $42,350 | $12,822 | $29,528 |
| 2015 | $1,165 | $42,350 | $12,822 | $29,528 |
| 2014 | $1,167 | $42,350 | $12,822 | $29,528 |
| 2013 | -- | $42,707 | $15,843 | $26,864 |
Source: Public Records
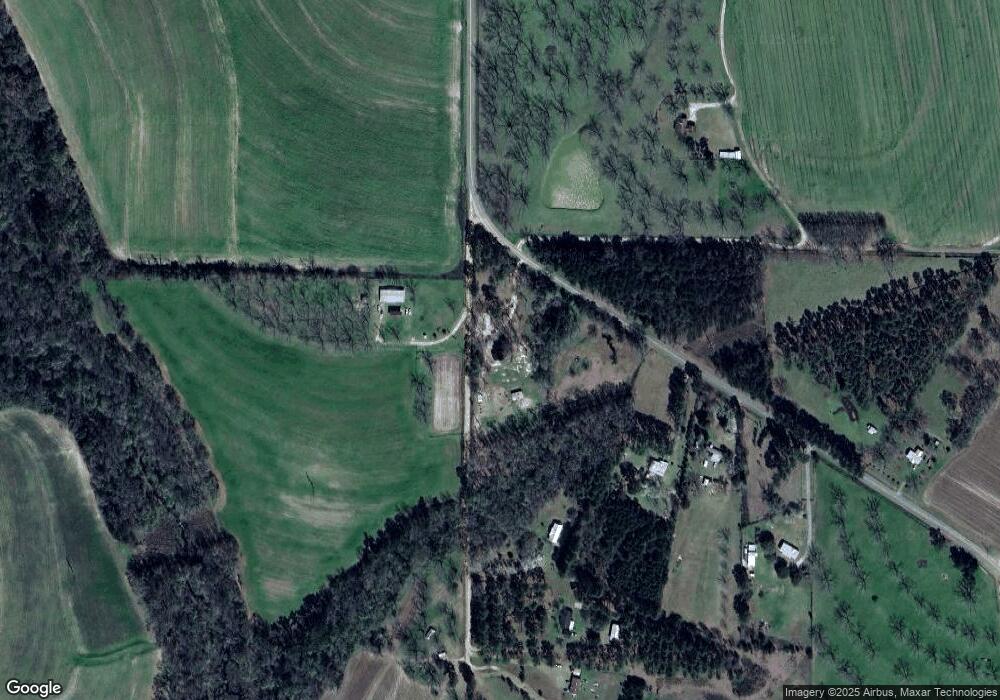
Map
Nearby Homes
Your Personal Tour Guide
Ask me questions while you tour the home.