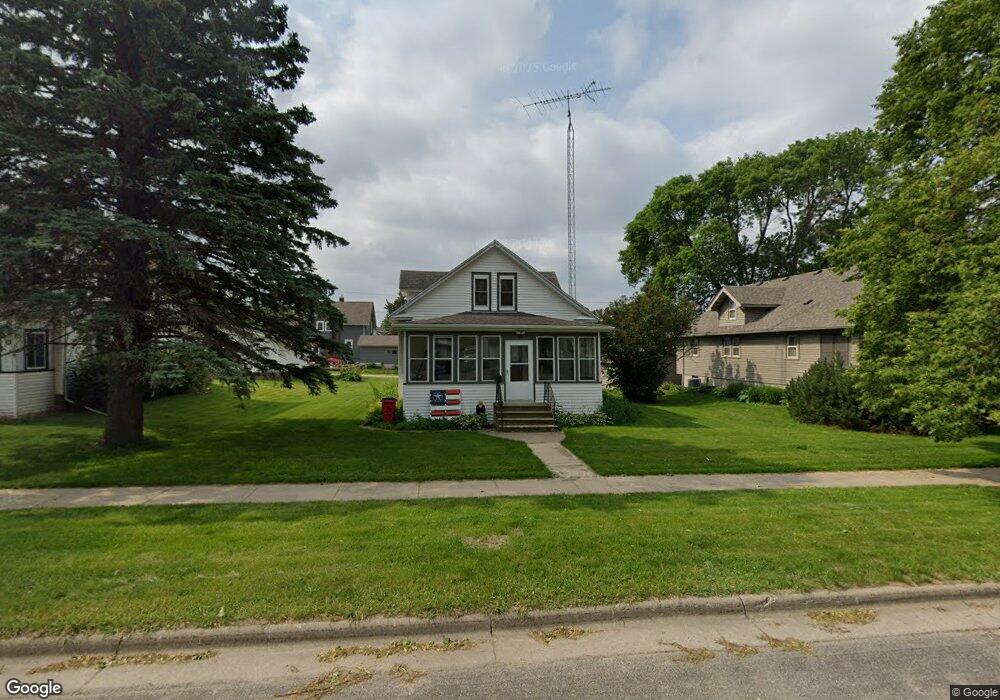
135 E Broadway Plainview, MN 55964
Estimated Value: $192,000 - $228,000
3
Beds
2
Baths
2,138
Sq Ft
$101/Sq Ft
Est. Value
About This Home
This home is located at 135 E Broadway, Plainview, MN 55964 and is currently estimated at $214,907, approximately $100 per square foot. 135 E Broadway is a home located in Wabasha County with nearby schools including Plainview-Elgin-Millville Elementary School (PK-3), Plainview-Elgin-Millville Elementary School (4-6), and Plainview-Elgin-Millville Junior High School.
Ownership History
Date
Name
Owned For
Owner Type
Purchase Details
Closed on
Mar 22, 2018
Sold by
Real Estate Growth Fund Llc
Bought by
Sackreiter Andrew J
Current Estimated Value
Home Financials for this Owner
Home Financials are based on the most recent Mortgage that was taken out on this home.
Original Mortgage
$87,400
Outstanding Balance
$75,036
Interest Rate
4.46%
Mortgage Type
Closed End Mortgage
Estimated Equity
$139,871
Purchase Details
Closed on
Dec 27, 2017
Sold by
Wells Fargo Bank Na
Bought by
Real Estate Growth Fund Llc
Purchase Details
Closed on
Sep 23, 2011
Sold by
Behrends James R and Behrends Patricia
Bought by
Eilert Randy J and Eilert Becky
Home Financials for this Owner
Home Financials are based on the most recent Mortgage that was taken out on this home.
Original Mortgage
$97,465
Interest Rate
4.25%
Mortgage Type
FHA
Create a Home Valuation Report for This Property
The Home Valuation Report is an in-depth analysis detailing your home's value as well as a comparison with similar homes in the area
Home Values in the Area
Average Home Value in this Area
Purchase History
| Date | Buyer | Sale Price | Title Company |
|---|---|---|---|
| Sackreiter Andrew J | $92,000 | Burnet Title | |
| Real Estate Growth Fund Llc | $413,688 | None Available | |
| Eilert Randy J | $220,000 | None Available |
Source: Public Records
Mortgage History
| Date | Status | Borrower | Loan Amount |
|---|---|---|---|
| Open | Sackreiter Andrew J | $87,400 | |
| Previous Owner | Eilert Randy J | $97,465 |
Source: Public Records
Tax History
| Year | Tax Paid | Tax Assessment Tax Assessment Total Assessment is a certain percentage of the fair market value that is determined by local assessors to be the total taxable value of land and additions on the property. | Land | Improvement |
|---|---|---|---|---|
| 2025 | $2,116 | $178,400 | $35,000 | $143,400 |
| 2024 | $2,116 | $173,600 | $35,000 | $138,600 |
| 2023 | $2,032 | $171,700 | $25,500 | $146,200 |
| 2022 | $1,782 | $158,600 | $21,000 | $137,600 |
| 2021 | $1,938 | $132,700 | $21,000 | $111,700 |
| 2020 | $1,998 | $136,200 | $21,000 | $115,200 |
| 2019 | $1,806 | $136,700 | $18,000 | $118,700 |
| 2018 | $1,766 | $121,100 | $18,000 | $103,100 |
| 2017 | $1,698 | $99,000 | $15,000 | $84,000 |
| 2016 | $1,210 | $0 | $0 | $0 |
| 2015 | $1,210 | $0 | $0 | $0 |
| 2012 | $828 | $0 | $0 | $0 |
Source: Public Records
Map
Nearby Homes
- 35 3rd St SE
- 115 3rd St SE
- 615 5th St NE
- 615 7th Ave NE
- 210 8th Ave NW
- 370 7th St SW
- 105 10th St NW
- 53022 253rd Ave
- 655 1st St SE
- 675 1st St SE
- 5 6th Ave SE
- 35 Ashley Ln
- 45 Rolling Hills Dr
- TBD Industrial Dr SE
- 135 5th Ave NW
- 57618 205th Ave
- 17063 County Road 10 NE
- 12510 County Road 9
- TBD 343rd Ave
- 53 1st Ave N
Your Personal Tour Guide
Ask me questions while you tour the home.