Estimated Value: $155,000 - $248,000
--
Bed
--
Bath
1,400
Sq Ft
$148/Sq Ft
Est. Value
About This Home
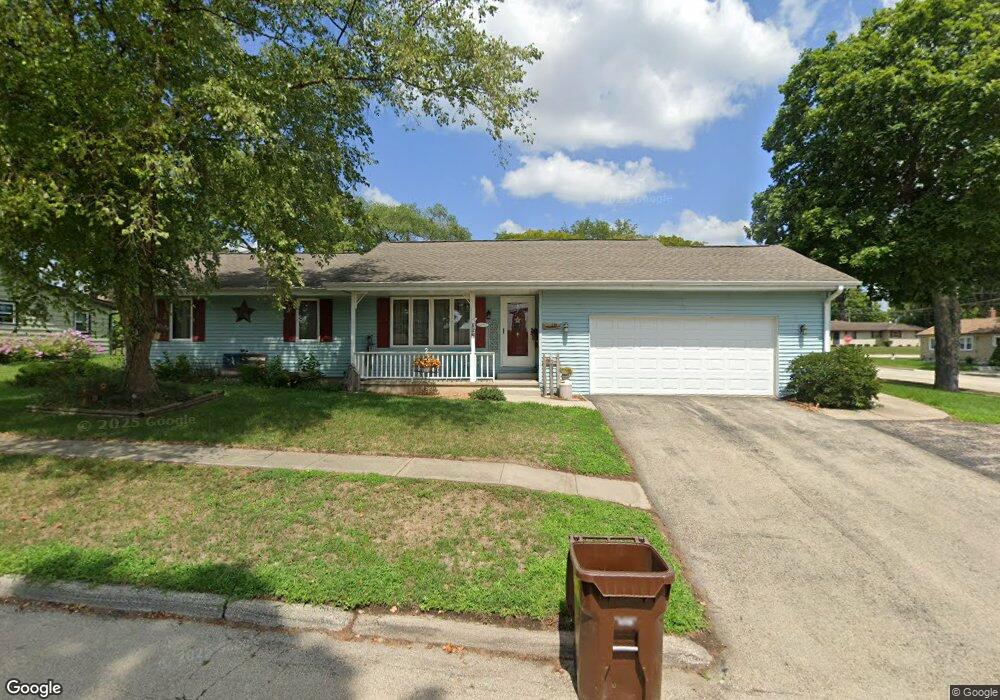
This home is located at 135 E Merchant St, Byron, IL 61010 and is currently estimated at $207,358, approximately $148 per square foot. 135 E Merchant St is a home located in Ogle County with nearby schools including Mary Morgan Elementary School, Byron Middle School, and Byron High School.
Create a Home Valuation Report for This Property
The Home Valuation Report is an in-depth analysis detailing your home's value as well as a comparison with similar homes in the area
Home Values in the Area
Average Home Value in this Area
Tax History Compared to Growth
Tax History
| Year | Tax Paid | Tax Assessment Tax Assessment Total Assessment is a certain percentage of the fair market value that is determined by local assessors to be the total taxable value of land and additions on the property. | Land | Improvement |
|---|---|---|---|---|
| 2024 | $3,978 | $57,372 | $9,410 | $47,962 |
| 2023 | $3,671 | $54,542 | $8,946 | $45,596 |
| 2022 | $3,394 | $50,581 | $8,296 | $42,285 |
| 2021 | $3,305 | $48,422 | $7,942 | $40,480 |
| 2020 | $3,030 | $47,472 | $7,786 | $39,686 |
| 2019 | $3,011 | $45,978 | $7,541 | $38,437 |
| 2018 | $2,987 | $44,791 | $7,346 | $37,445 |
| 2017 | $2,956 | $44,791 | $7,346 | $37,445 |
| 2016 | $2,762 | $43,969 | $7,211 | $36,758 |
| 2015 | $3,014 | $42,565 | $6,981 | $35,584 |
| 2014 | $2,982 | $42,565 | $6,981 | $35,584 |
| 2013 | $3,089 | $43,113 | $7,071 | $36,042 |
Source: Public Records
Map
Nearby Homes
- 401 W 3rd St
- 429 N Union St
- 503 W 2nd St
- 521 N Walnut St
- 423 W 4th St
- 8890 Hales Corner Rd Rd
- 1269 E Kysor Rd
- 4934 E Ashelford Dr
- 00 E Ashelford Dr Unit LOT 8
- 00 E Ashelford Dr
- 309 Creekside Dr
- 265 Creekside Dr
- 5166 E Hubbard Trail
- 5304 E Hubbard Trail
- 0 N Kishwaukee Rd Lot Unit WP001
- 815 Hampton Dr
- 1245 Glacier Dr
- 1257 Glacier Dr
- 8692 Glacier Dr
- 1368 Joanne Terrace
- 134 E Front St
- 125 E Merchant St
- 120 E Front St
- 309 S Chestnut St
- 130 E Merchant St
- 128 E Merchant St
- 122 E Merchant St
- 211 S Chestnut St
- 116 E Front St
- 117 E Merchant St
- 311 S Chestnut St
- 204 E Front St
- 137 E Front St
- 127 E Diamond St
- 125 E Diamond St
- 123 E Diamond St
- 203 E Front St
- 112 E Front St
- 115 E Front St
- 120 E Blackhawk Dr