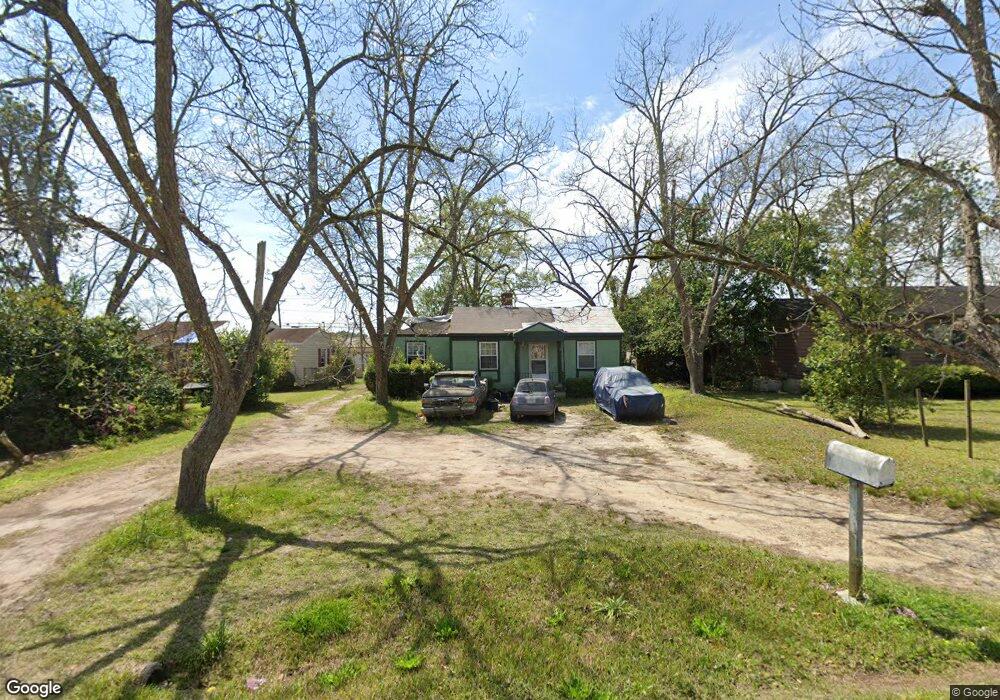
135 Edgewood Dr Cordele, GA 31015
Estimated Value: $58,000 - $110,000
2
Beds
2
Baths
1,025
Sq Ft
$79/Sq Ft
Est. Value
About This Home
This home is located at 135 Edgewood Dr, Cordele, GA 31015 and is currently estimated at $81,163, approximately $79 per square foot. 135 Edgewood Dr is a home located in Crisp County with nearby schools including Crisp County Elementary School, Crisp County Primary School, and Crisp County Middle School.
Ownership History
Date
Name
Owned For
Owner Type
Purchase Details
Closed on
Sep 21, 2012
Sold by
Federal National Mortgage Association
Bought by
Lerma Jose Luis
Current Estimated Value
Purchase Details
Closed on
May 1, 2012
Sold by
Sprinkel Vera May
Bought by
Onewest Bank Fsb
Purchase Details
Closed on
Jan 18, 2008
Sold by
Sprinkel Herbert D
Bought by
Sprinkel Herbert D and Sprinkle Verma May
Purchase Details
Closed on
Jun 4, 1997
Sold by
Pridgen Mrs W C
Bought by
Sprinkel David and Sprinkel Ve
Purchase Details
Closed on
Feb 4, 1975
Sold by
Hinton Mrs John T
Bought by
Pridgen Mrs W C
Purchase Details
Closed on
Jun 30, 1959
Bought by
Hinton Mrs John T
Create a Home Valuation Report for This Property
The Home Valuation Report is an in-depth analysis detailing your home's value as well as a comparison with similar homes in the area
Home Values in the Area
Average Home Value in this Area
Purchase History
| Date | Buyer | Sale Price | Title Company |
|---|---|---|---|
| Lerma Jose Luis | $15,000 | -- | |
| Onewest Bank Fsb | $20,000 | -- | |
| Federal National Mtg Associati | $20,000 | -- | |
| Sprinkel Herbert D | -- | -- | |
| Sprinkel David | $25,000 | -- | |
| Pridgen Mrs W C | -- | -- | |
| Hinton Mrs John T | -- | -- |
Source: Public Records
Mortgage History
| Date | Status | Borrower | Loan Amount |
|---|---|---|---|
| Closed | Lerma Jose Luis | $0 |
Source: Public Records
Tax History Compared to Growth
Tax History
| Year | Tax Paid | Tax Assessment Tax Assessment Total Assessment is a certain percentage of the fair market value that is determined by local assessors to be the total taxable value of land and additions on the property. | Land | Improvement |
|---|---|---|---|---|
| 2024 | $709 | $19,792 | $2,000 | $17,792 |
| 2023 | $704 | $18,773 | $2,000 | $16,773 |
| 2022 | $469 | $17,730 | $2,000 | $15,730 |
| 2021 | $459 | $16,687 | $2,000 | $14,687 |
| 2020 | $470 | $16,687 | $2,000 | $14,687 |
| 2019 | $473 | $16,687 | $2,000 | $14,687 |
| 2018 | $461 | $15,627 | $2,000 | $13,627 |
| 2017 | $635 | $15,627 | $2,000 | $13,627 |
| 2016 | $462 | $15,627 | $2,000 | $13,627 |
| 2015 | -- | $15,627 | $2,000 | $13,627 |
| 2014 | -- | $15,627 | $2,000 | $13,627 |
| 2013 | -- | $15,627 | $2,000 | $13,627 |
Source: Public Records
Map
Nearby Homes
- 1101 Schley Ave
- 0 Pecan St S
- 1001 Stewart Ave
- 912 Rose Ln
- 1022 E 29th Ave
- 1509 E 20th Ave
- 723 E 24th Ave
- 724 E 26th Ave
- 1002 Camellia Dr
- 720 E 20th Ave
- 3041 E Ga Hwy 280
- 705 E 21st Ave
- 619 E 26th Ave
- 616 E 23rd Ave
- 607 E 27th Ave
- 716 E 18th Ave
- 618 E 27th Ave
- 615 E 28th Ave
- 714 E 18th Ave
- 510 E 25th Ave
- 137 Edgewood Dr
- 133 Edgewood Dr
- 00 E 24th Ave
- E E 24th Ave
- 139 Edgewood Dr
- 131 Edgewood Dr
- 118 Edgewood Dr
- 129 Edgewood Dr
- 141 Edgewood Dr
- 116 Edgewood Dr
- 127 Edgewood Dr
- 1314 Schley Ave
- 143 Edgewood Dr
- 122 Edgewood Dr
- 114 Edgewood Dr
- 125 Edgewood Dr
- 145 Edgewood Dr
- 124 Edgewood Dr
- 110 Edgewood Dr
- 112 Edgewood Dr